Article Text

Abstract
Objective Detection of subclinical cardiovascular disease (CVD) has significant impact on the management of type 2 diabetes. We examined whether the assessment of diabetic retinopathy (DR) is useful for identifying patients at a higher risk of having silent CVD.
Research design and methods Prospective case–control study comprising 200 type 2 diabetic subjects without history of clinical CVD and 60 age-matched non-diabetic subjects. The presence of subclinical CVD was examined using two parameters: (1) calcium coronary score (CACs); (2) composite of CACs >400 UA, carotid plaque ≥3 mm, carotid intima–media thickness ratio >1, or the presence of ECG changes suggestive of previous asymptomatic myocardial infarction. In addition, coronary angio-CT was performed. DR was assessed by slit-lamp biomicroscopy and retinography.
Results Type 2 diabetic subjects presented higher CACs than non-diabetic control subjects (p<0.01). Age, male gender, and the presence of DR were independently related to CACs >400 (area under the receiver operating characteristic curve (AUROC) 0.76). In addition, an inverse relationship was observed between the degree of DR and CACs <10 AU. The variables independently associated with the composite measurement of subclinical CVD were age, diabetes duration, the glomerular filtration rate, microalbuminuria, and the presence of DR (AUROC 0.71). In addition, a relationship (p<0.01) was observed between the presence and degree of DR and coronary stenosis.
Conclusions The presence and degree of DR is independently associated with subclinical CVD in type 2 diabetic patients. Our results lead us to propose a rationalized screening for coronary artery disease in type 2 diabetes based on prioritizing patients with DR, particularly those with moderate–severe degree.
- retinopathy
- cardiovacsular disease(s)
- type 2 diabetes
This is an open access article distributed in accordance with the Creative Commons Attribution Non Commercial (CC BY-NC 4.0) license, which permits others to distribute, remix, adapt, build upon this work non-commercially, and license their derivative works on different terms, provided the original work is properly cited, appropriate credit is given, any changes made indicated, and the use is non-commercial. See: http://creativecommons.org/licenses/by-nc/4.0/.
Statistics from Altmetric.com
Significance of this study
What is already known about this subject?
Diabetic retinopathy is associated to cardiovascular events in diabetic population.
What are the new findings?
Diabetic retinopathy is a powerful and independent risk factor for identifying diabetic subjects with subclinical cardiovascular disease.
The presence of diabetic retinopathy confers a higher risk of subclinical cardiovascular disease than factors contained in contemporary risk equations such as blood pressure, low-density lipoprotein (LDL) cholesterol and HbA1c.
There is a clear relationship between the presence and degree of diabetic retinopathy and coronary stenosis.
How might these results change the focus of research or clinical practice?
The presence and degree of diabetic retinopathy should be considered a better tool for identifying type 2 diabetic subjects at risk of cardiovascular disease than the traditional risk factors.
Type 2 diabetic patients with diabetic retinopathy and in particular those patients with moderate–severe degree represent a good target population for a cost-effective cardiovascular screening.
The detection and grading of diabetic retinopathy permit us to identify a high-risk subset of diabetic population who might benefit most from tight control of cardiovascular risk factors. In addition, given that these patients are more prone to develop cardiovascular disease, they could be used to enrich the cohorts for future intervention trials, thus reducing sample size, duration, and costs of studies.
Introduction
Diabetes mellitus (DM) is one of the leading causes of mortality and major morbidities, including cardiovascular disease (CVD), kidney failure, lower limb amputation, and blindness. In fact, diabetic complications account for much of the social and financial burden of diabetes.1 2
Patients with diabetes generally have a greater extent of atherosclerosis with a higher prevalence of multivessel coronary artery disease (CAD) and infarction compared with the non-DM population.3 4 Once CAD manifests clinically, diabetic patients continue to have a worse prognosis compared with non-diabetic patients, both during acute ischemic events and during long-term follow-up.5 However, the increase in CVD risk is not homogeneous in patients with DM. In fact, a significant number of these patients will never experience CV complications, and current guidelines consistently advise against the routine use of prophylactic aspirin in patients with DM.6 7 Therefore, the early identification of diabetic patients at risk of developing CVD remains a challenge.8 9
The high prevalence of type 2 diabetes precludes implementing a generalized screening for CVD in asymptomatic patients.6 7 On the other hand, the traditional risk factors associated with diabetes (ie, hypertension, dyslipidemia, obesity) are estimated to contribute in less than 40% of CV events. In fact, these factors are not useful for identifying the coronary asymptomatic patients in which the screening could be cost-effective.8 9 Therefore, cheap and routinely available measures that identify those patients at high risk of developing CVD are needed.
Carotid ultrasound to measure carotid intima–media thickness (CIMT) and a coronary artery calcium scan to quantify coronary calcification have been used as non-invasive techniques to identify subclinical atherosclerosis.10 CIMT has been widely used as a marker to identify subclinical atherosclerosis, as increased CIMT has been associated with a high prevalence of CAD and future CV events.3 A recent study has found that carotid plaque is predictive of underlying silent coronary atherosclerosis prevalence, severity, and extent in asymptomatic type 2 diabetic patients.11 Extensive data indicate a close relationship between the coronary artery calcium score (CACs) and clinical coronary events among individuals with and without diabetes.12–15 In addition, it has been shown that the prognostic significance of elevated CACs in predicting coronary events appears to be greater in patients with diabetes than in those without diabetes, and it can further enhance the predictions provided by established risk models.15 16 Moreover, the CACs has been related to moderate to large perfusion defects assessed by scintigraphy.4 For all these reasons, the Imaging Council of the American College of Cardiology concluded that CAC screening is the most sensitive risk stratification tool among asymptomatic persons with diabetes.17 Patients are typically stratified by Agatston units (AU), yielding a CACs <100 (low risk), 100 to 400 (moderate risk), and >400 (high risk). Notably, the finding of a CACs of <10 AU may facilitate risk stratification by enabling the identification of people at very low risk within the overall high-risk population of diabetic patients.18 In this regard, it should be noted that the absence of coronary calcium portends a remarkably favorable prognosis despite the presence of DM, with no patients experiencing adverse cardiac events during 5 years of follow-up.15 Nevertheless, widespread screening for silent CAD in diabetes cannot be recommended at this time19 and, consequently, the identification of a more targeted population in which the CACs would be more cost-efficient seems warranted.
Emerging evidence indicates that microangiopathy is independently associated with an increased risk of CV events in diabetic patients.20 A recent population-based cohort study showed that the cumulative burden of microvascular disease increases the risk of future CVD among individuals with type 2 diabetes.21 However, whereas microalbuminuria and macroalbuminuria are frequently included among the risk factors in the studies addressed to evaluate CV events, the presence and degree of diabetic retinopathy (DR) is often missing.
On this basis, the main aim of the present study was to determine whether the assessment of DR could help in identifying those in the diabetic population who should be candidates for CACs assessment. Since the screening of DR is an essential part of diabetes care, this approach would not increase the economic burden associated with diabetes management. In addition, the usefulness of DR in identifying subclinical CVD measured by the composite of a CACs >400, carotid plaque ≥3 mm, CIMT >1, or the presence of ECG changes suggestive of previous asymptomatic myocardial infarction (MI) was also examined. In the present work, we show the first results of the baseline data of the PRECISED study which is mainly addressed to further clarify the impact of the presence and degree of microangiopathy on CV events in type 2 diabetic patients.
Research design and methods
Study design, data source, and patient enrollment
This was a prospective case–control study comprising a total of 200 type 2 diabetic subjects with no history of clinical CVD and 60 non-diabetic subjects matched by age (control group) (PRECISED study: ClinalTrial.gov NCT02248311).
The inclusion criteria were (1) age from 50 to 79 years and (2) a history of type 2 diabetes diagnosed at least 1 year prior to the day of screening. The exclusion criteria were (1) a medical history of a CV event, (2) type 1 diabetes, (3) any contraindication for the performance of PET/CT or MRI, and (4) any concomitant disease associated with a short life expectancy.
The subjects were recruited from the Outpatient Diabetic Clinic of Vall d’Hebron Hospital and the Primary Healthcare centers within its catchment area (North Barcelona). A total of 2631 clinical records of subjects with type 2 diabetes were reviewed: 1912 did not meet the inclusion criteria, leaving 719 eligible for screening; out of these, 200 subjects with type 2 diabetes agreed to participate in the study. A total of 60 age-matched non-diabetic subjects without a history of CVD served as a control group. These individuals were recruited from the same Primary Healthcare centers and most were relatives of diabetic subjects. A flowchart showing the recruitment process is displayed in online supplementary figure S1.
Supplemental material
Classic risk factors
Anthropometric measurements and classical risk factors
Clinical data were obtained on the first visit by an endocrinologist. Anthropometric data were obtained by standardized protocols at the same visit. Weight and height were measured with a balance with a fixed stadiometer to determine the body mass index (BMI). Hypertension was defined as systolic blood pressure ≥140 mm Hg or diastolic blood pressure ≥90 mm Hg, or when patients were under treatment with antihypertensive agents.
A history of smoking habits (non-smoker/current smoker/ex-smoker) was recorded. Smokers who stopped smoking ≥1 year prior to recruitment were considered ex-smokers.
Dyslipidemia was defined by the use of lipid-lowering drugs, decreased values of high-density lipoprotein (HDL) cholesterol (men <0.9 mmol/L, women <1.0 mmol/L), or by at least one increased value of total cholesterol (>5.2 mmol/L), low-density lipoprotein (LDL) cholesterol (>4.3 mmol/L), or triglycerides (>1.7 mmol/L). Framingham and United Kingdom Prospective Diabetes Study-coronary heart disease (UKPDS-CHD) were calculated as described elsewhere.22
Fundus examination
DR was evaluated by experienced ophthalmologists in mydriasis using slit-lamp biomicroscopy and retinography with the same camera (Topcon-DRI-OCT-TRITON). The examiners classified DR according to the International Clinical Diabetic Retinopathy Disease Severity Scale23: (1) no apparent retinopathy, (2) mild non-proliferative retinopathy (NPDR), (3) moderate NPDR, (4) severe NPDR, and (5) proliferative diabetic retinopathy (PDR).
Laboratory tests
A venous blood sample was collected from the antecubital vein, separated by centrifugation (2000×g at 4°C for 20 min) and frozen at −80°C for batched storage and analysis. Glycosylated hemoglobin was determined by the Cobas B 101 (Roche) system. The remaining biochemical parameters were measured using an Olympus AU5400 automatic biochemistry analyzer (Olympus, Tokyo, Japan).
Assessment of subclinical CVD
Subclinical CVD was defined as the composite of a CACs >400, carotid plaque ≥3 mm, or CIMT >1. The presence of ECG changes suggestive of previous asymptomatic MI (Minnesota codes 1.1. and 1.2) was also considered subclinical CVD.
Electrocardiogram
A 12-lead ECG was taken after the patient had been lying down for at least 5 min. The ECG was evaluated by a cardiologist.
Carotid ultrasonography
All study participants underwent a standard echo-color Doppler examination of the extracranial carotid arteries (common carotid artery, internal and external carotid artery) by means of a high-frequency linear probe (vivid 7-GE and vivid 9, Medical Systems, GE Healthcare, with linear probe 7 MHz).
Conventional ultrasound (B-mode and color Doppler) was used to measure common IMT and to identify the presence of carotid plaques according to the Mannheim consensus.24 Extracranial carotid arteries were explored axially and longitudinally. We measured the IMT of the far wall of the common carotid artery at the level of 1 cm proximal to the bifurcation bilaterally. We used the mean value obtained from three measurements for our analysis. Frequency of carotid plaques was defined as the presence of plaques in any of the explored territories. The assessment of all the measurements and the performance of the ultrasound studies were performed by two researchers (TG-A and LG), who were blinded to the conditions of the participants.
CT-CAC scanning
An ECG synchronized prospective non-enhanced cardiac CT was performed with Siemens Biograph mCT 64 s equipment. The calcium score was analyzed using semi-automatic methodology with “Syngo.Via” cardiac CT software, the global and individual Agatston score for coronary vessels being calculated. Patients were classified by AU as low risk (<100 AU), moderate risk (100–400 AU), or high risk (>400 AU).18
Coronary angio-CT
After patient preparation with beta blockers for decreased heart rate, and nitroglycerin for vasodilatation if required, an ECG synchronized prospective contrast-enhanced coronary CT was performed with Siemens Biograph mCT 64 s equipment. Automatic coronary vessel extraction of all coronary vessels with visual analysis of coronary stenosis was performed by researchers blind to the patient’s condition with “Syngo.Via” cardiac CT software as described elsewhere.25
Statistical analysis
The categorical variables are presented as percentages. For the quantitative variables, the mean and SD are displayed, except for triglycerides, lipoprotein (a), and homocysteine in which median and range were used. Differences among groups were assessed using the χ2 test for qualitative variables, while t-test quantitative variables with a normal distribution, and non-parametric tests were used for those quantitative variables without a normal distribution.
Diabetic subjects were divided into two groups: those with calcium scores higher and lower than 400 AU. Logistic regression analysis to predict a CACs higher than 400 AU was performed using the variables that were significant at the univariant analysis. ROC curves were calculated and the χ2 test for ROC area comparison was performed, the complete logistic model being compared with a logarithmic transformation of the microalbuminuria:creatinine ratio.
The differences between diabetic subjects with the combined endpoint defined above and those without it were assessed. Selected variables that were significant at the univariate analyses were used to predict the combined endpoint by forward stepwise selection method in a binary logistic regression analysis. ROC curves were calculated. The area under the receiver operating characteristic curves (AUROCs) for the UKPDS-CHD and Framingham risk scores for predicting the presence of the combined endpoint and the effect of the addition of DR and/or microalbuminuria were calculated.
Significance was accepted at the level of p value <0.05 for all the analyses. Statistical analyses were performed with the Stata statistical package.
Results
Clinical characteristics
The general characteristics as well as the main laboratory findings in subjects with type 2 diabetes and non-diabetic controls are shown in table 1. We did not find any significant difference between groups regarding age, gender, ethnicity, smoking habit, family history of CVD, or in laboratory parameters of kidney function (creatinine and glomerular filtration rate (GFR), aspartate aminotransferase (AST) and gamma-glutamyl transferase (GGT). Subjects with type 2 diabetes presented a significantly higher BMI and waist circumference, as well as a higher prevalence of hypertension and dyslipidemia. Therefore, as expected, significantly more subjects were treated with angiotensin receptor blockers, ACE inhibitors, and statins in the diabetic group in comparison with non-diabetic controls. As expected, HbA1c was significantly higher in the diabetic population than in control subjects. We also found significantly higher levels of alanine transaminase (ALT) in diabetic subjects in comparison with controls.
Characteristics of subjects with type 2 diabetes and non-diabetic control subjects
The specific characteristics of subjects with diabetes are displayed in online supplementary table S1. In summary, the type 2 diabetic patients included in the study exhibited a long-term duration of diabetes with relatively good metabolic control (HbA1c: 57.85±12.56 mmol/mol (7.43%±1.18%)). Around 60% were under combined treatment with metformin plus insulin or insulin alone, and up to 30% presented at least one microangiopathic complication. One out of 200 included patients (0.5%) presented ECG signs of a previous MI.
DR is related to the CACs
The distribution of control and diabetic subjects, taking into account the CACs, is shown in online supplementary table S2. As expected, type 2 diabetic patients presented higher CACs than non-diabetic control subjects. Among type 2 diabetic patients, gender, age, waist circumference, serum levels of homocysteine, and the presence of DR were significantly different in those patients with a CACs ≥400 AU in comparison with patients with <400 AU (table 2).
Characteristics of subjects with type 2 diabetes according to the calcium score
The logistic regression model, which included the variables with statistical significance in the univariate study, showed that only age, gender, and the presence of DR were independently related to a CACs >400 AU (table 3A). The model for identifying type 2 diabetic subjects with a CACs >400 showed an AUROC of 0.77 (95% CI 0.72 to 0.83; p<0.00001).
(A) Results of the logistic regression analysis for predicting the presence of a calcium coronary score (CACs) ≥400 AU in subjects with type 2 diabetes. (B, C) Results of the logistic regression analysis for predicting the presence of subclinical cardiovascular disease (CVD) in subjects with type 2 diabetes assessed by the combined endpoint (CACs ≥400 AU, carotid plaque ≥3 mm, carotid intima–media thickness >1, or ECG changes suggestive of previous asymptomatic myocardial infarction). Variables that were significant at a p value <0.05 in the univariate analysis of online supplementary table S3 (comparison between the presence or not of the combined endpoint) were entered in the model as independent variables (age, diabetes duration, hypertension, homocysteine, glomerular filtration rate (GFR), the presence of microalbuminuria and/or diabetic retinopathy (DR)), adjusting for gender and dyslipidemia. A forward stepwise selection method was used with a significance level of 0.05. In table 3C, the same analyses have been performed but DR was classified into no-DR or mild and moderate to severe DR/proliferative DR.
We also observed an inverse relationship between the degree of DR and a CACs <10 AU. In this regard, 93.9% of patients with no or only mild DR presented a CACs <10 whereas this percentage was as low as 6.1% in those patients with moderate–severe DR.
Relationship between the CACs and coronary stenosis
Type 2 diabetic patients presented a significantly higher proportion of coronary stenosis (stenosis >50% in at least in one coronary artery) than non-diabetic control subjects (24.3% vs 9.1%; p=0.03). Online supplementary figure S2 displays the localization of these stenoses in the coronary arteries.
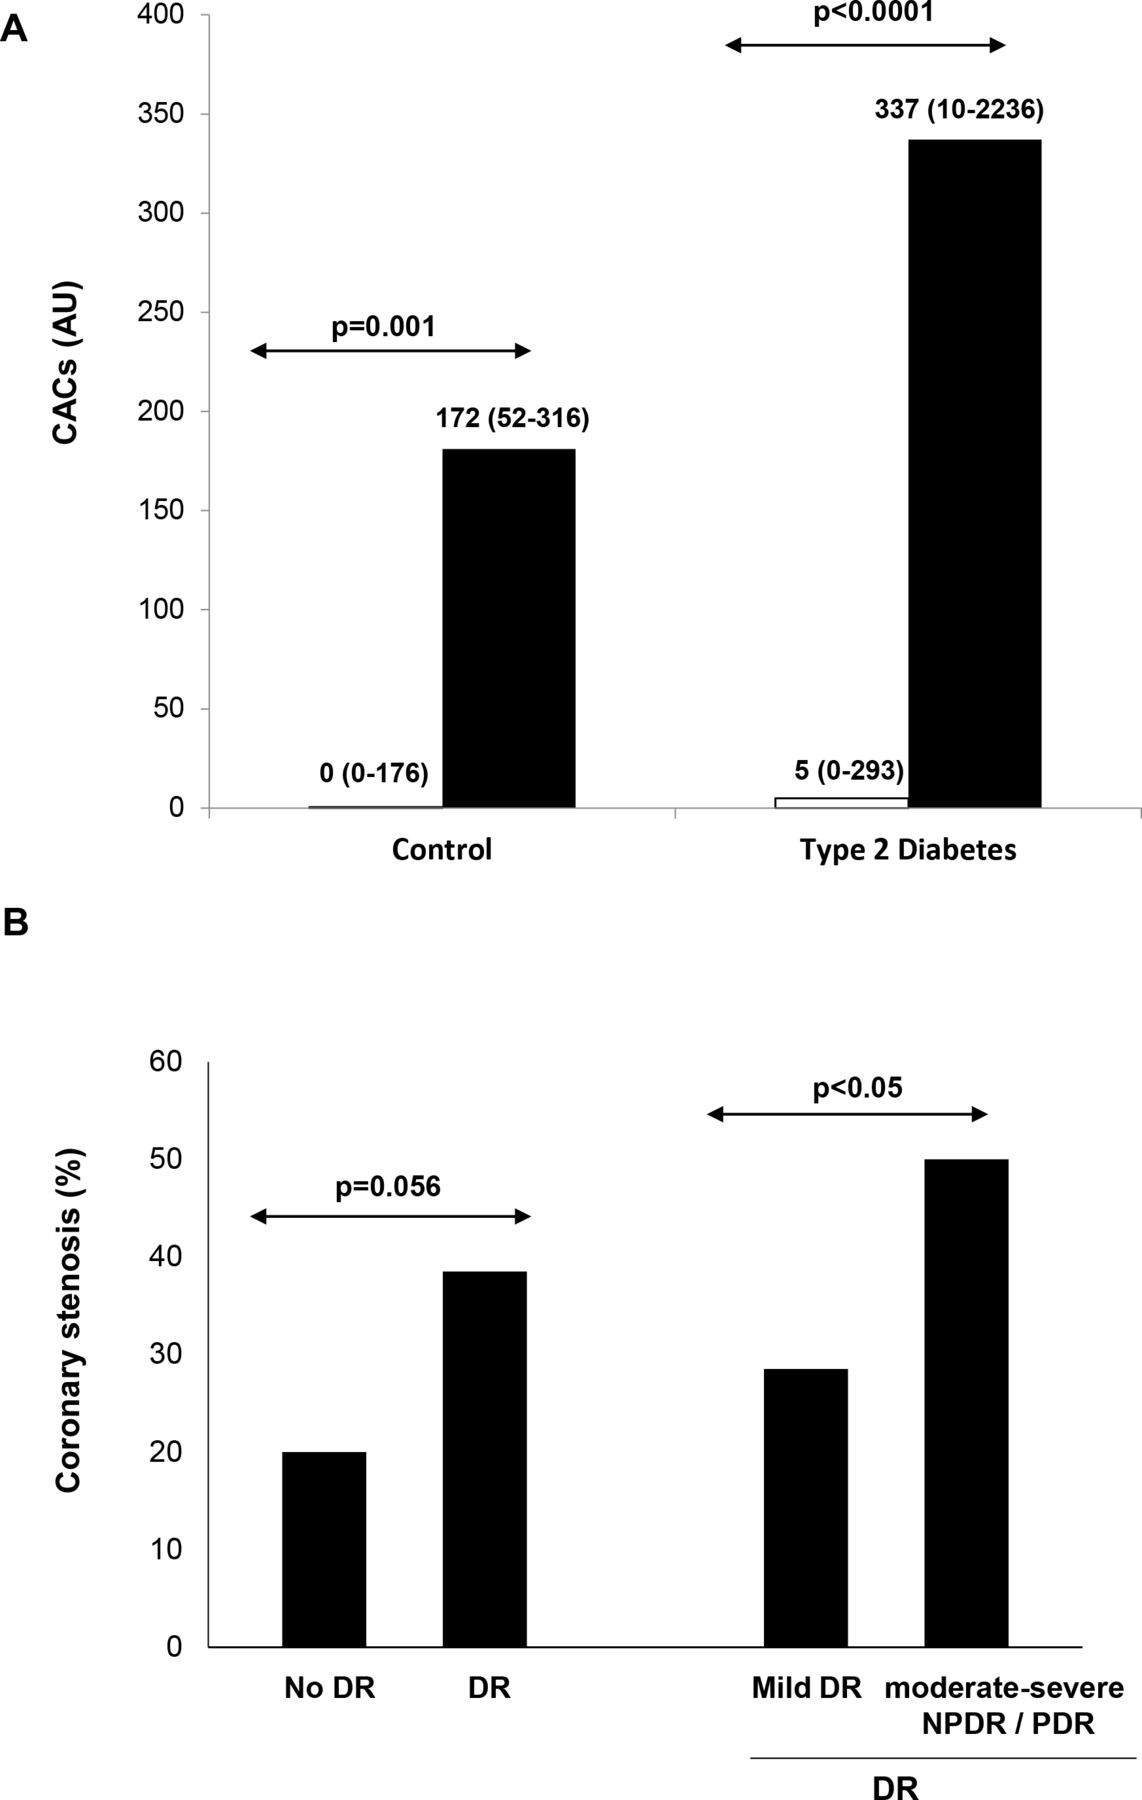
As expected, we found a clear relationship between the CACs and the presence of coronary stenosis in both diabetic and non-diabetic control subjects (figure 1A). Diabetic subjects with coronary stenosis presented a significantly higher CACs (AU) than diabetic subjects without coronary stenosis (337 (95% CI 10 to 2236) vs 5 (95% CI 0 to 293); p<0.0001). Also, a clear relationship between the presence and degree of DR and the presence of one or more coronary stenoses was found (figure 1B).
(A) Calcium coronary score (CACs, AU) in subjects with coronary stenosis (black columns) and without coronary stenosis (white columns). Data are median (95% CI 5% to 95%). (B) Association between coronary stenosis and the presence and degree of diabetic retinopathy (DR). NPDR, non-proliferative diabetic retinopathy; PDR, proliferative diabetic retinopathy.
Subclinical CVD
The presence of subclinical CVD assessed by the combined endpoint was higher in type 2 diabetic patients than in the control group (65.7% vs 44%; p=0.05). The main clinical characteristics of type 2 diabetic patients according to the presence or absence of the combined endpoint is displayed in online supplementary table 3. Type 2 diabetic patients with the combined endpoint were older, presented longer diabetes duration, more frequent hypertension, higher homocysteine levels, higher levels of creatinine, a lower GFR, higher microalbuminuria levels, and a higher frequency of DR. In addition, those patients with moderate–severe DR presented a higher prevalence of subclinical CVD assessed by the combined endpoint in comparison with patients with mild DR or the absence of DR (91.3% vs 60.8%; p=0.004).
The logistic regression model in which DR was introduced as a categorical variable (yes/no) showed that DR was not an independent variable accounting for the combined endpoint (table 3B). However, when DR was introduced as absence–mild DR versus moderate–severe, it was strongly associated with the combined endpoint (OR 8.53 (95% CI 1.05 to 69.12)) (table 3C). The AUROC of this model for identifying subclinical CVD using the combined endpoint was 0.69 (95% CI 0.61 to 0.76; p<0.05). When, in the same model, microalbuminuria was added to the DR categorized as moderate–severe versus no or mild DR, the strength of the association increased (9.04 (95% CI 1.05 to 77)) as well as the AUROC (0.72 (95% CI 0.64 to 0.78; p<0.05)).
The probability of having a CACs ≥400 AU, carotid plaque ≥3 mm, CIMT >1, and the composite endpoint according to the presence and degree of DR is represented in online supplementary table 4. The presence of DR significantly increases the risk of CACs ≥400 AU and the composite endpoint.
Finally, the discrimination abilities of the United Kingdom Prospective Diabetes Study (UKPDS) and Framingham cardiovascular risk scores to predict the combined endpoint of subclinical cardiovascular disease, adding DR (categorized as either “yes or no” or “moderate–severe vs no or mild DR”) alone or in combination with microalbuminuria, were calculated and compared employing the AUROC. We found that it was only when DR was categorized as moderate to severe versus no or mild DR that the AUROC increased significantly (table 4).
Comparisons between UKPDS-CHD (CHD=coronary heart disease) (A) and Framingham risk scores (B) with and without the addition of microalbuminuria (no/yes), diabetic retinopathy (DR) (no/yes), DR+microalbuminuria, moderate–severe DR, and moderate–severe DR+microalbuminuria in assessing the presence of the combined endpoint
Discussion
The present study provides evidence that DR is a powerful and independent risk factor for identifying diabetic subjects with subclinical CVD. In fact, we have found that the assessment of DR is a good and independent predictor of both a CACs >400 AU and the composite of a CACs >400 AU, carotid plaque ≥3 mm, and CIMT >1. In addition, a clear relationship between the presence and degree of DR and coronary stenosis was found. These findings suggest that type 2 diabetic subjects with DR represent a subset of patients at very high risk of CVD who need a specific program aimed at reducing CV risk factors, optimizing metabolic control, and providing a periodic assessment of CVD. It should be noted that the presence of DR confers a higher risk of subclinical CVD than factors contained in contemporary risk equations, such as blood pressure, LDL cholesterol, and HbA1c. In this regard, we have found that moderate–severe DR significantly increases the AUROC of the UKDPS and Framingham risk scores CHD in predicting the presence of the combined endpoint of subclinical CVD.
Consistent with our findings, previous reports have documented an increase in CV risk in patients with DR, particularly in those with advanced DR.26–29 For instance, de Kreutzenberg et al,30 in a large cohort of type 2 diabetic subjects found that DR alone or in combination with nephropathy was independently associated with the presence of carotid plaques, and that severity of microangiopathy correlates with severity of carotid atherosclerosis. In addition, coronary atherosclerosis and plaque vulnerability are more severe in patients with DR.31 Overall, this information suggests that CAD is mediated by microvessel damage within the arterial wall (the vasa vasorum) induced by diabetes.32 Recent evidence indicates that in subjects with type 2 diabetes, the vasa vasorum presents evolutionary changes similar to those observed in the retina: an initial stage in which endothelium dysfunction and loss of capillaries predominates,33 and more advanced stages in which ischemia plays a key role, leading to angiogenesis and plaque neovascularization.33–35 This change in plaque phenotype results in a more inflamed and unstable plaque, favoring plaque rupture and a poor outcome of CV events. Thus, microcirculation represents a “common soil” between DR and CAD, and it may no longer make sense to consider microangiopathy and macroangiopathy as entirely separated entities in the setting of DM.
The screening of CVD in the diabetic population continues to be a challenge. An analysis of pooled population-based studies showed that in adults older than 60 years without known atherosclerotic CVD at baseline, the CACs has a greater association with incident CHD (follow-up 11 years) and a modestly improved prediction of incident stroke.36 In addition, in the diabetic population, the severity of the CACs appeared to be a more important clinical prognostic indicator than measures of disease severity, such as insulin use, glycemic control, and diabetes duration.37 Our study further supports this concept and, in addition, shows a clear relationship between a CACs >400 AU and coronary artery stenosis in type 2 diabetic subjects. However, given the high prevalence of diabetes, it is desirable to identify a more targeted population in which screening by using the CACs could be recommended. This would increase the cost-effectiveness of screening and avoid unnecessary irradiation. We found that by using simple clinical parameters such as age, gender, and the assessment of DR, the AUROC for predicting a CACs >400 was 0.77. In addition, CACs <10 was also associated with the absence of, or just mild DR.
Overall, our results point to type 2 diabetic patients with DR as a subset of the diabetic population at a high risk of having silent CVD and, in consequence, more prone to develop a cardiovascular outcome. However, given that the prevalence of DR in type 2 diabetic subjects is around 30%, it still remains a huge population as regards recommending screening for silent CVD. The high risk in those patients with moderate–severe DR of exhibiting subclinical CVD points to this specific subset of patients as the most cost-effective candidates for screening. Therefore, healthcare professionals involved in the treatment of patients with diabetes should contemplate those individuals with moderate–severe DR as a high-risk population independently of the association of other traditional CV risk factors.
CT angiography images of coronary artery stenosis provide a better prediction risk in asymptomatic type 2 diabetics than traditional risk factors and the CACs.38 39 Notably, we have found for the first time a relationship between DR and the presence of coronary stenosis assessed by coronary CT angiography. Patients with DR presented a higher proportion of having one or more coronary stenoses ≥50% than those patients without DR (38.5% vs 20.2%). In addition, this proportion was even higher (50%) in those patients with moderate–severe NPDR and PDR.
Apart from DR, we found that microalbuminuria was associated with subclinical CVD assessed by the combined endpoint, but it was unrelated to the CACs or the presence of coronary stenosis. This finding suggests that microalbuminuria reflects a more widespread atherosclerotic process, whereas the presence and degree of DR might be more directly related to CAD. It should be noted that there is extensive evidence indicating that microalbuminuria is an independent CV risk factor and it is generally considered in the design and the analysis of the results of clinical trials on CVD performed in the diabetic population. However, this is not the case for DR. This is a significant drawback that could lead to a serious bias on the results obtained in both epidemiologic and interventional studies.
Our results underline the importance of screening for DR, which should be envisaged as a method for studying the microvasculature of the retina and its potential implications in vision loss, and also as a herald of other systemic complications of diabetes, including CVD. Retinal imaging has the significant advantage of not using ionizing irradiation and it is performed as routine screening in the diabetic population. Given the alarming increase in the number of people with diabetes and the shortage of trained retinal specialists and graders of retinal photographs, an automated approach involving a computer-based analysis of the fundus image would reduce the burden of health systems in screening for DR.40 41 There is hence an increasing interest in the development of automated analysis software using artificial intelligence/deep neural learning for the analysis of retinal images in people with diabetes,41 and it is foreseeable that specific software will be developed to better define the cardiovascular risk of diabetic individuals based on the retinal structural and functional findings of microvessels.
The low percentage of silent MI detected by ECG in our cohort, 1 out 200 (0.5%), is quite surprising. In the UKPDS, 1 in 6 (16%) patients with newly diagnosed type 2 diabetes had evidence of silent MI on the baseline surface ECG.42 In older studies, the prevalence of ECG abnormalities in patients with type 2 diabetes and no known CAD was even higher, approaching 20%.43 44 The low rate of silent MI in our diabetic population could not be attributed to low diabetes duration or a selected group with low diabetes-related systemic complications. In fact, the mean of known diabetic duration was 12 years, around 30% of the subjects already presented microangiopathic complications, and more than half required treatment with insulin. It should be noted that this low rate of ECG signs of asymptomatic ischemic heart disease did not mean the presence of low myocardial microangiopathy. In this regard, we have previously reported that DR was independently associated with myocardial perfusion defects.45 Altogether, these findings suggest that our population could have a high degree of protection against CV outcomes despite having a high rate of cardiovascular risk factors including microangiopathy. A Mediterranean diet and the high proportion of patients under treatment with statins might help explain why we detected a very low rate of silent MI; however, specific studies aimed at examining this issue are needed.
This study has several limiting factors. First, the analyses were restricted to individuals for whom complete information was available, and this may have resulted in selection bias. Second, the results could have been affected by variables such as diet or ambient factors not considered in this analysis. Third, the study population was relatively small and the data presented are observational in nature. Finally, although our results suggest that the assessment of DR may offer a simple tool to identify very high-risk individuals with type 2 diabetes who are currently perceived to be at low absolute risk using contemporary risk models, all the risk algorithms (eg, QRISK, Framingham, Reynolds, UKDPS) are for calculating risk estimates and not for the detection of subclinical atherosclerosis. Therefore, further studies with a larger sample size are required to evaluate whether the addition of DR grading to conventional risk algorithms will confer any additional benefits.
Our findings could have both therapeutic and investigational implications. In fact, the detection and grading of DR permits us to identify patients at high CV risk who might, under current guidelines, benefit most from further lipid and blood glucose lowering, or it could be used to enrich the cohorts for future intervention trials with patients more prone to develop clinical outcomes, thus reducing sample size, duration, and the cost of studies.
In summary, the presence of DR is an independent predictor of CACs >400 AU, and moderate–severe DR is independently associated with subclinical CVD. Therefore, the presence and degree of DR should be considered a better tool for identifying type 2 diabetic patients at risk of CVD than the conventional CV risk factors used in current risk equations. Our results have significant clinical implications in terms of proposing a rationalized screening of CAD based on prioritizing patients with DR, in particular those with a moderate–severe degree.
References
Footnotes
RS and IF contributed equally.
Deceased In the memory of the beloved Dr. Garcia-Dorado. Passed away on August 16th 2019.
Contributors RS, IF, and DG-D conceived the study concept and design, interpreted data, and contributed to critically revising the manuscript. JB, CH, and OS-S analyzed data and drafted the manuscript. JR-P, FV, LG, TG-A, SA-B, AB, and OS-S contributed to the collection and interpretation of data. SA-B, JM, DS, JG, and JG-A contributed to the study design, data interpretation, and revised the manuscript for important intellectual content. All authors approved the final article. RS, SA-B, JM, DS, JG, and DG-D obtained funding. RS and IF are the guarantors of this work and, as such, had full access to all the data in the study and take responsibility for the integrity of the data and the accuracy of the data analysis.
Funding This work was supported by an Integrative Excellence Project by the Spanish Institute of Health, Instituto de Salud Carlos III, grant PIE 2013/27, CIBER CV, CIBERDEM, and the European Regional Development Fund (ERDF-FEDER). The Neurovascular Research Laboratory is part of the Spanish Stroke Research Network INVICTUS+ (RD16/0019/0021).
Competing interests None declared.
Patient consent for publication Obtained.
Ethics approval The study was conducted according to the Declaration of Helsinki and was approved by the local ethics committee.
Provenance and peer review Not commissioned; externally peer reviewed.
Data availability statement All data relevant to the study are included in the article or uploaded as online supplementary information.