Article Text

Abstract
Introduction Differences in mortality and cause-specific mortality rates according to glycated albumin (GA) and hemoglobin A1c (HbA1c) levels among dialysis patients with diabetes based on hypoglycemic agent use and malnutrition status remain unclear. Here, we examine these associations using a nationwide cohort.
Research design and methods We examined 40 417 dialysis patients with diabetes who met our inclusion criteria (female, 30.8%; mean age, 67.3±11.2 years; mean dialysis duration, 5.4±4.6 years). The Global Leadership Initiative on Malnutrition criteria were used to assess malnutrition. Adjusted HRs and 95% confidence limits were calculated for 3-year mortality after adjustment for 18 potential confounders. HRs and subdistribution HRs were used to explore cause-specific mortality.
Results We found a linear association between 3-year mortality and GA levels only in patients with GA ≥18% and not in patients with low GA levels, with a U-shaped association between HbA1c levels and the lowest morality at an HbA1c 6.0%–6.3%. This association differed based on patient conditions and hypoglycemic agent use. If patients using hypoglycemic agents were malnourished, mortality was increased with GA ≥24% and HbA1c ≥8%. In addition, patients with GA ≥22% and HbA1c ≥7.6% had significantly higher infectious or cardiovascular mortality rates. On the other hand, an inverse association was found between GA or HbA1c levels and cancer mortality. Patients with GA ≤15.8% had a higher risk of cancer mortality, especially those not using hypoglycemic agents (HR 1.63 (1.00–2.66)).
Conclusions Target GA and HbA1c levels in dialysis patients may differ according to hypoglycemic agent use, nutritional status, and the presence of cancer. The levels may be higher in malnourished patients than in other patients, and a very low GA level in dialysis patients not taking hypoglycemic agents may be associated with a risk of cancer.
Trial registration number UMIN000018641.
- mortality
- dialysis
- hypoglycemic agents
- malnutrition
This is an open access article distributed in accordance with the Creative Commons Attribution Non Commercial (CC BY-NC 4.0) license, which permits others to distribute, remix, adapt, build upon this work non-commercially, and license their derivative works on different terms, provided the original work is properly cited, appropriate credit is given, any changes made indicated, and the use is non-commercial. See: http://creativecommons.org/licenses/by-nc/4.0/.
Statistics from Altmetric.com
Significance of this study
What is already known about this subject?
It was suggested that glycated albumin (GA) has superior potential compared with hemoglobin A1c (HbA1c) as a glycemic marker in dialysis patients because GA is less affected by anemia.
What are the new findings?
We found a linear association between 3-year mortality and GA levels only in patients with GA ≥18% and not in patients with low GA levels, with a U-shaped association between HbA1c levels and the lowest morality at an HbA1c 6.0%–6.3%.
Target GA and HbA1c levels in dialysis patients may differ according to hypoglycemic agent use, nutritional status, and the presence of cancer.
The target GA level in patients using hypoglycemic agents is less than <22% and can be relaxed to <24% if patients are malnourished.
Patients with GA ≤15.8% had a higher risk of cancer mortality, especially those not using hypoglycemic agents.
How might these results change the focus of research or clinical practice?
These data may suggest that target GA and HbA1c levels should be modified based on patient conditions.
Introduction
With an increase in dialysis patients with diabetes mellitus, adequate glycemic control remains essential for the management of these patients. The standard method of monitoring glycemic control has been the periodic measurement of the level of hemoglobin A1c (HbA1c). On the other hand, the validity of HbA1c measurement for these patients has been debated, as HbA1c may be affected by anemia and erythrocyte lifespan. Recently, some reports have suggested the superiority of using glycated albumin (GA) rather than HbA1c.1–4 We previously reported a linear or J-shaped association between GA and 1-year mortality, whereas there was a U-shaped association between HbA1c and mortality.3 With regard to long-term mortality, Chen et al1 recently analyzed the association between baseline GA levels and 4-year mortality in 1053 dialysis patients and reported that the adjusted HR for 4-year mortality was significantly increased only in patients with GA levels >21%, whereas it was not increased in those with lower GA. However, whether a lower GA level is associated with better or worse mortality is still unclear. The current guidelines for diabetes management do not fully describe this association. Moreover, the association between glycemic control and cause-specific mortality in dialysis patients is not fully understood. Here, we reported an association of baseline GA levels with cause-specific 3-year mortality, stratified by patient nutritional condition, using a nationwide registry of dialysis patients in Japan.
Methods
Database creation
This is a retrospective cohort study of Japanese nationwide annual questionnaire surveys of dialysis facilities conducted by the Japanese Society for Dialysis Therapy (JSDT). The details have been described previously.5–8 The standard analysis file, which was prepared by the Committee of Renal Data Registry for the present study, covered patients with diabetes who were diagnosed with diabetes and/or received diabetic medications, were on maintenance hemodialysis on 31 December 2013, and were followed for 3 years from 2013 to 2016. We excluded patients who lacked a history of diabetes, received dialysis fewer than three times a week or for less than 2 hours/day, underwent organ transplantation, or received peritoneal dialysis and those whose records covering date of birth, dialysis initiation, levels of GA, or outcome were incomplete or included outliers (online supplemental figure S1).
Supplemental material
The database contains demographic data, laboratory examinations, and dialysis information, as described in table 1. Methods of laboratory data refining were reported previously.3 9 The laboratory value of whole parathyroid hormone (PTH) was converted to intact PTH by multiplying by 1.7. The database was designed as a questionnaire-based registry; thus, all measurements were routinely carried out at each facility. However, all GA measurements in Japan were performed via an enzymatic method using the same Lucica GA-L kit (Asahi Kasei Pharma, Tokyo, Japan),10 and all HbA1c measurements were standardized following the Japanese Diabetes Society guidelines.11 To assess the malnutrition status of the patients, the Global Leadership Initiative on Malnutrition criteria12 were used, and patients with serum albumin levels <3.8 g/dL and those whose body mass index (BMI) was low (<18.5 if <70 years and <20 if ≥70 years) or who experienced weight loss more than 10% during 2013–2014 were defined as having malnutrition.
Characteristics of dialysis patients with diabetes
Statistical methods
Patient demographics were summarized by the mean and SD or by the median and IQR, and these data were compared by the χ2 test, t-test, or Wilcoxon U test, as appropriate. GA and HbA1c levels were categorized using the deciles of patients who had GA measurements. The cut-offs for GA levels were 15.8%, 17.2%, 18.3%, 19.3%, 20.4%, 21.5%, 22.9%, 24.8% and 28.0%, with GA 15.9%–17.2% as the reference. The cut-offs for HbA1c levels were 5.0%, 5.3%, 5.6%, 5.8%, 6.0%, 6.3%, 6.6%, 7.0%, and 7.6%, with an HbA1c of 6.0%–6.3% as the reference. We estimated the association between baseline glycemic control groups and all-cause mortality with 95% confidence limits (95% CL) with Cox regression and analyzed both unadjusted and adjusted models for relevant covariates measured at the study baseline, including age, sex, vintage, dialysis modality, BMI, smoking, vascular complications, hypoglycemic agent use, antihypertensive drug use, hemoglobin, albumin, C-reactive protein (CRP), Kt/V, normalized protein catabolic rate, high-density lipoprotein cholesterol, calcium, phosphate, and PTH. The hypoglycemic agents reported here include insulin, dipeptidyl peptidase-4 inhibitor (DPP4i), and oral hypoglycemic agents (OHAs). The time at risk started at study enrollment and ended at death, follow-up loss, or transplantation. Analyses were stratified by tertiles of hemoglobin, albumin, and age as well as by history of cardiovascular diseases (CVD); hypoglycemic agents were used to determine the interaction between glycemic control and these factors. The proportional hazards assumption was verified using negative log survival curves and Schoenfeld residuals. For cause-specific death analyses, because other causes of death were considered competing risks, the Fine and Gray models, as well as cause-specific Cox hazard models, were used to incorporate the rates of competing risks into the cumulative incidence function and subdistribution HRs (SHRs).13 14 After Cox regressions and competing risk regressions, we used the cubic spline with a 5 knots approach to arrive at figures of HRs or SHRs with continuous GA or HbA1c values. In addition, adjusted incidence rates (IR) for each cause of death were compared among the GA or HbA1c groups. All analyses were performed with STATA SE software V.14.2 (StataCorp, College Station, TX, USA). The study was registered with the University Hospital Medical Information Network.
Patient involvement
Patients were not directly involved in the design, conduct, reporting, or dissemination of our research. However, the JSDT holds annual meetings to communicate with health professionals and patients and has appreciated receiving many valuable comments related to our study and the survey itself that may benefit patients and care providers.
Results
After exclusions, 40 417 hemodialysis patients with diabetes mellitus (27 761 patients with hypoglycemic agent use, 12 656 patients without hypoglycemic agent use) were included in this study. As shown in table 1, the characteristics of the 40 417 patients were as follows: mean age 67.3±11.2 years, mean dialysis vintage 5.4±4.6 years, 30.7% female, 22.3±0.1 kg/m2 BMI, 10.0% on hemodiafiltration, 38.2% with CVD history (including stroke, cardiac ischemia, myocardial infarction, and amputation), 3.6±0.4 g/dL albumin, 107±12 g/L hemoglobin, 6.2%±1.1% HbA1c, 21.3%±5.3% GA, and 20.5% with malnutrition. The proportions of insulin users, DPP4i users, and OHA users were 35.8%, 31.8%, and 22.9%, respectively. The average values of age and dialysis vintage were lower, and those of BMI, HbA1c, GA, as well as the proportions of patients who were female, smokers, on hemodiafiltration, and malnourished were higher in patients using hypoglycemic agents than in those not using hypoglycemic agents (table 1). During observation, 10 154 deaths (2195 infection-related deaths, 3898 cardiovascular-related deaths, 827 cancer-related deaths, and 3234 other deaths) were recorded.
All-cause mortality stratified by serum GA levels
After adjusting for age, sex, vintage, dialysis modality, BMI, smoking, vascular complications, hypoglycemic drug use, antihypertensive drug use, hemoglobin, albumin, CRP, Kt/V, normalized protein catabolic rate, high-density lipoprotein cholesterol, calcium, phosphate, and PTH at baseline, the relationship between the adjusted HRs and GA was J shaped, with the lowest HR associated with the GA level 15.9%–17.2% (table 2 and figure 1A). The adjusted HRs of all-cause 3-year mortality were linearly increased after the minimum and were significantly worse in patients with GA levels >21.5%. This trend was the same as the trend of all-cause 1-year mortality we previously reported.3 When we stratified these relationships by tertiles of hemoglobin, albumin, and age to explore possible interactions, the slope became steeper in patients who had higher serum albumin levels or older age and in those who lacked a CVD history (online supplemental figure S2).
The adjusted all-cause mortality by serum glycated albumin levels in dialysis patients with diabetes

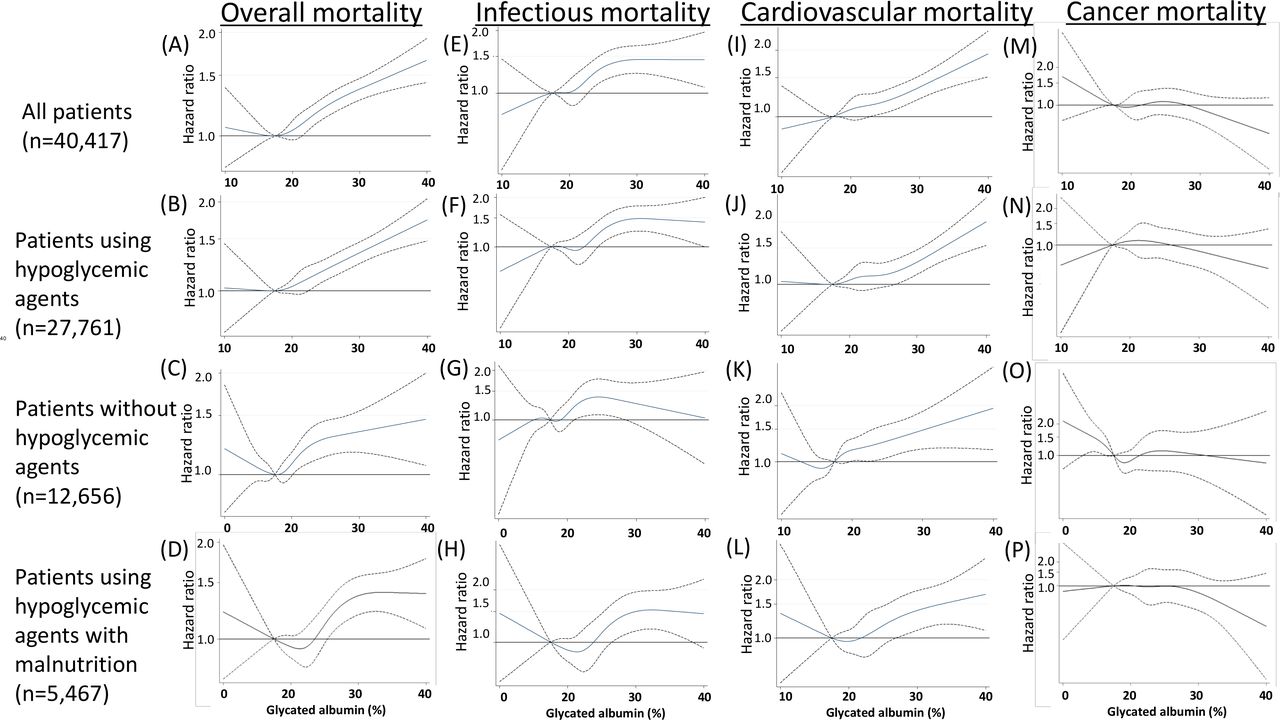
Mortality rates stratified by continuous glycated albumin levels. Overall mortality (HRs) in (A) all patients with diabetes (n=40 417), (B) patients with hypoglycemic agent use (n=27 761), (C) patients without hypoglycemic agent use (n=12 656), and (D) patients with malnutrition using hypoglycemic agents (n=5467). Infection-related mortality (HRs) in (E) all patients with diabetes, (F) patients using hypoglycemic agents, (G) patients not using hypoglycemic agents, and (H) patients with malnutrition using hypoglycemic agents. Cardiovascular-related mortality (HRs) in (I) all patients with diabetes, (J) patients using hypoglycemic agents, (K) patients not using hypoglycemic agents, and (L) patients with malnutrition using hypoglycemic agents. Cancer-related mortality (HRs) in (M) all patients with diabetes, (N) patients using hypoglycemic agents, (O) patients not using hypoglycemic agents, and (P) patients with malnutrition using hypoglycemic agents. Hypoglycemic agents included insulin, dipeptidyl peptidase-4 inhibitor (DPP4i), and oral hypoglycemic agents (OHA). HRs were calculated by the Cox model. The adjusted baseline variables were as follows: age, sex, vintage, dialysis modality, body mass index, smoking, vascular complications, hypoglycemic drug use, antihypertensive drug use, hemoglobin, albumin, C-reactive protein, Kt/V, normalized protein catabolic rate, high-density lipoprotein cholesterol, calcium, phosphate, and parathyroid hormone. The cubic spline with a 5 knot approach was used to arrive at figures of these ratios with continuous glycated albumin (GA) values.
The relationship was similar when we limited the patients to hypoglycemic agent users (figure 1B). Nevertheless, in patients without hypoglycemic agent use, the relationship was U shaped with the lowest GA level of 15.9%–17.2% (figure 1C). In addition, a U-shaped relationship between the adjusted HR and GA was also observed in hypoglycemic agent users with malnutrition, although the lowest HRs were observed in patients with GA levels of approximately 21%, which was higher than the levels in other patient groups (figure 1D). Therefore, the normal reference range of GA for patients with normal kidney function, 11.9%–15.8%, may not be adequate for hemodialysis patients with diabetes, especially those who are malnourished or who are not prescribed hypoglycemic agents. Based on these findings, the target GA level in patients with hypoglycemic agents is less than <22% and can be relaxed to <24% if patients are malnourished.
Cause-specific mortality by serum GA levels
Next, we examined cause-specific 3-year mortality stratified by serum GA levels in our cohort. Based on records of death codes in our data set, we categorized causes of death as infection-related death, cardiovascular-related death, cancer-related death, and others. Considering other causes of death as competing risk events, the relationships between the HRs/SHRs and GA stratified by each cause of death are shown in figure 1 and table 3. For infection-related mortality, the relationship was linear, with a plateau among patients with GA levels >23% regardless of the use of hypoglycemic agents (figure 1E–G). For cardiovascular-related mortality, the relationship was also linear regardless of the use of hypoglycemic agents (figure 1I–K). On the other hand, for cancer-related mortality, the relationships between HRs/SHRs and GA were quite different between hypoglycemic agent users and non-users. The HRs/SHRs almost plateaued (or were slightly mountain shaped) at all GA levels in hypoglycemic agent users, whereas in patients not using hypoglycemic agents, the HRs of cancer-related mortality were the highest in patients with GA ≤15.8% (HR 1.63 (1.00, 2.66), reference, GA 15.9 to ≤17.2%), and the HRs/SHRs of those with higher GA levels were almost the same (figure 1M–O, table 3). This worsened cancer mortality in the lower GA group was observed only in hypoglycemic agent non-users. In hypoglycemic agent users with malnutrition, the relationship between HRs/SHRs and GA was flat or mountain shaped (figure 1P), suggesting that glycemic control by hypoglycemic agents may be less important for patient cancer-specific mortality.
Adjusted cause-specific mortality rates stratified by serum glycated albumin levels in dialysis patients with diabetes
Overall and cause-specific mortality by serum HbA1c levels
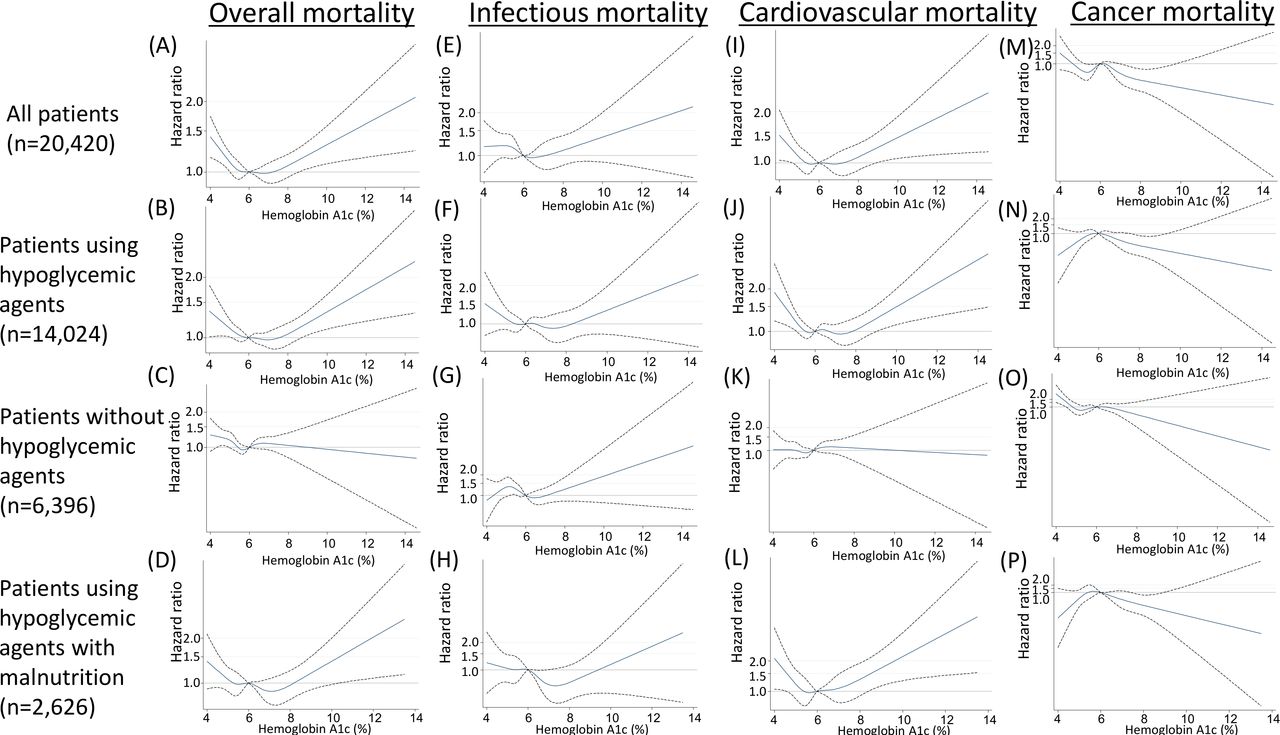
To clarify how GA performed compared with traditional HbA1c, we examined overall and cause-specific 3-year mortality stratified by serum HbA1c levels among patients with HbA1c measurements (n=20 420) in this cohort. After adjusting the same variables, the relationship between the adjusted HRs and HbA1c was U shaped, with the lowest HR associated with an HbA1c level of 6.1%–6.3% (figure 2A, online supplemental table S2). The trends were similar when we limited the patients to hypoglycemic agent users, although the lowest HRs were observed with HbA1c levels of 6.4%–7.0% in those with malnutrition (figure 2B–D).
Mortality rates stratified by continuous hemoglobin A1c levels. Overall mortality (HRs) in (A) all patients with diabetes (n=20 420), (B) patients with hypoglycemic agent use (n=14 024), (C) patients without hypoglycemic agent use (n=6396), and (D) patients with malnutrition using hypoglycemic agents (n=2626). Infection-related mortality (HRs) in (E) all patients with diabetes, (F) patients using hypoglycemic agents, (G) patients not using hypoglycemic agents, and (H) patients with malnutrition using hypoglycemic agents. Cardiovascular-related mortality (HRs) in (I) all patients with diabetes, (J) patients using hypoglycemic agents, (K) patients not using hypoglycemic agents, and (L) patients with malnutrition using hypoglycemic agents. Cancer-related mortality (HRs) in (M) all patients with diabetes, (N) patients using hypoglycemic agents, (O) patients not using hypoglycemic agents, and (P) patients with malnutrition using hypoglycemic agents. Hypoglycemic agents included insulin, dipeptidyl peptidase-4 inhibitor (DPP4i), and oral hypoglycemic agents (OHAs). HRs were calculated by the Cox model. The adjusted baseline variables were as follows: age, sex, vintage, dialysis modality, body mass index, smoking, vascular complications, hypoglycemic drug use, antihypertensive drug use, hemoglobin, albumin, C-reactive protein, Kt/V, normalized protein catabolic rate, high-density lipoprotein cholesterol, calcium, phosphate, and parathyroid hormone. The cubic spline with a 5 knot approach was used to arrive at figures of these ratios with continuous HbA1c values.
Considering other causes of death as competing risk events, the relationships between the HRs and HbA1c stratified by each cause of death are shown in figure 2 and online supplemental table S2. Similar to the previous findings, U-shaped associations were found between HbA1c and infectious or cardiovascular mortality. Patients with HbA1c ≥7.6% had significantly higher infectious or cardiovascular mortality rates (figure 2E–L). On the other hand, inverse association trends were observed between HbA1c levels and cancer mortality (figure 2M–P).
Adjusted IRs by serum GA levels
To compare the risks of each cause of death stratified by hypoglycemic drug use, we calculated IRs for mortality adjusting for age, sex, vintage, dialysis modality, BMI, smoking, vascular complications, antihypertensive drug use, hemoglobin, albumin, CRP, Kt/V, normalized protein catabolic rate, high-density lipoprotein cholesterol, calcium, phosphate, and PTH at baseline. The relationship between the adjusted overall mortality rates and GA was similarly U shaped, with the lowest IR at GA levels of 15.9%–17.2%. The overall IRs were smaller in patients with hypoglycemic drug use than in those without drug use at all GA levels (online supplemental figure S3, online supplemental table S1). In addition, a steeper slope was observed for the association between cardiovascular mortality rates and GA level than for the association between overall mortality and GA level. Interestingly, the difference in cardiovascular-related mortality rates between hypoglycemic users and non-users increased with increasing GA levels. In addition, the cancer-related mortality rates of hypoglycemic agent non-users with very low GA levels (≤15.8%) were slightly higher than those of patients in other categories, while those of hypoglycemic agent users were almost the same at any GA level (online supplemental figure S3, online supplemental table S1).
Discussion
In this study, we examined associations between 3-year mortality and GA and HbA1c levels and found that they were substantially different based on causes of death and patient backgrounds. Based on our findings, the target GA level in patients using hypoglycemic agents is less than <22% and can be relaxed to <24% if patients are malnourished. Additionally, the target GA level can be lowered to <20.5% to prevent cardiovascular mortality. On the other hand, inverse associations were found between GA levels and cancer mortality. In HbA1c analyses, we found similar trends to those in the GA analyses. The target HbA1c level in patients using hypoglycemic agents is 5.3%–7.6% and can be relaxed to <8.0% in those with malnutrition.
A major strength of this study is that this is the first and largest cohort study examining the effects of GA and HbA1c levels stratified by patient nutritional conditions on long-term mortality and cause-specific mortality in patients with diabetes on hemodialysis. The nationwide questionnaire-based study design may have resulted in some selection bias, recall bias, misclassification bias, or errors in the data collection process. Additionally, as with any annual survey, our database contains a one-point estimate of glycemic control per year, rendering analyses with time-averaged GA levels within the observational period impossible. However, considering the size of the study and the very high response rate (98.7% of facilities in Japan15), these biases are likely to have been minimized. Second, we lacked information about the use of erythropoietin-stimulating agents and some residual confounders. However, because it was reported that GA was not affected by the lifespan of red cells, the effects of these drugs on the GA-mortality association may be small and may not change our conclusions. In addition, when we compared patient 3-year mortality between these two groups, we found 75.5 (75.1, 76.0)% in those with GA measurements and 74.4 (74.0, 74.8)% in those without GA measurements (p<0.01). Therefore, the lack of measurement of GA may have resulted in an underestimation in our results. Furthermore, we captured only mortality. We could not evaluate the incidence of infection, CVD events, or cancer. The quality of facilities and access to facilities may also affect the association between incidence and mortality.
Previously, Chen et al1 reported that high GA measurements were associated with increased 4-year mortality in 1053 patients with diabetes on dialysis. Similar findings were also reported by Fukuoka et al16 (n=98) and Freedman et al17 (n=401 on hemodialysis and n=43 on peritoneal dialysis). However, all these previous reports focused only on associations between higher GA levels and all-cause and/or cardiovascular-related mortality. Because of the limited number of patients in these studies, they concluded that all-cause and cardiovascular mortalities were higher or linearly increased in patients with higher GA levels. Additionally, these studies did not take into account competing risks. A linear association between cardiovascular mortality and GA levels was also reported in non-dialysis-dependent patients with chronic kidney disease.18 Here, we found a linear relationship between overall and cardiovascular mortality in patients with GA levels ≥17.5%. These associations were flat in patients using hypoglycemic agents with GA levels <17.5%, and they became J or U shaped in patients with malnutrition or those not using hypoglycemic agents.
In this study, overall mortality and cardiovascular-related mortality were poor in dialysis patients with diabetes who had low GA levels and did not use hypoglycemic agents. These patients may represent patients with so-called ‘burnt-out diabetes’, who experience spontaneous resolution of hyperglycemia and do not need hypoglycemic agents due to malnutrition, protein energy wasting or other reasons.19 Because worse mortality has been reported for these patients,19–21 the mortality of the patients with lower GA was understandably increased. The most frequent cause of death in patients with diabetes on hemodialysis was cardiovascular demise in Japan (26.0% at December 2015) and other countries.15 Therefore, it is reasonable to assume that the association of overall mortality with GA was similar to that of cardiovascular mortality. In fact, Ricks et al21 reported that both overall mortality and cardiovascular mortality had similarly U-shaped associations with HbA1c, with the lowest mortality in those whose HbA1c level was 6%–8%. Notably, their HbA1c levels associated with the lowest mortality were slightly higher than our results. However, the different ‘best’ HbA1c levels in dialysis patients between the USA and Japan are consistent with previous findings.22 23 Patients’ sociodemographic and comorbidity characteristics and dialysis practice pattern differences may influence this phenomenon.
The reason the ‘best GA level’ was different among patients with and without malnutrition is unknown. The amount of muscle, serum albumin, or chronic infectious status could affect the level of GA or glycogenesis. However, we need to remember that the GA reference range for patients with normal kidney function (11.9%–15.8%24) may not be suitable for dialysis patients, especially those with sarcopenic conditions or those not using hypoglycemic agents. Because the HRs/SHRs of cardiovascular-related death and cancer-related death in those with lower GA levels were similar to the HRs/SHRs in those with higher GA levels of 20%–22%, the higher mortality in these patients may be mainly due to an increased risk of infection-related death. Therefore, we should be aware of the risk of infection in patients with lower GA levels, especially patients with malnutrition. With increasing numbers of elderly individuals and patients with diabetes and frailty, the target range of GA may become a substantial problem throughout the world. Our results may help improve patient care and may contribute to future guidelines for the management of patients with diabetes on dialysis.
In patients not using hypoglycemic agents, we found that lower GA levels were associated with a higher risk of cancer-related death. This association may be a reverse causal relationship, and thus, it may be reasonable to assume that very low GA levels were observed in patients with poor general condition who were going to die within 3 years. Interestingly, a recent health check-up cohort study reported a U-shaped association between HbA1c levels and future malignancies in a population without diabetes. They suggested that a low HbA1c level may be associated with the incidences of breast cancer and female genital cancer.25 Although their population was different from ours, it is noteworthy to suggest that low GA in dialysis patients with diabetes not using hypoglycemic agents may indicate an increased risk of cancer-related death. Therefore, if we encounter patients with very low GA levels, cancer screening tests may be recommended for early detection. In other words, very low GA levels in those patients could be considered an alert for cancer screening. Unfortunately, serum glucose levels were not assessed in our cohort. Therefore, it is unknown whether lower GA levels were associated with hypoglycemia or a cachexic condition in patients with malignancy. A comparison of continuous glucose monitoring with GA levels in these patients should be performed to understand the mechanism underlying this phenomenon. Finally, the adjusted mortality rates, including infection-related death and cardiovascular-related death, were consistently lower in patients using hypoglycemic agents than in non-users in any group at the same GA levels. These results may suggest that some pleiotropic effects for mortality beyond glycemic control may be present in those using hypoglycemic agents.
In conclusion, we found that the association between 3-year mortality and GA level was linear only in patients with GA ≥18% and not in patients with a low GA level. Target GA and HbA1c levels in dialysis patients may differ according to hypoglycemic agent use, nutritional status, and the presence of cancer. The levels may be higher in malnourished patients than in other patients, and a very low GA level in dialysis patients not taking hypoglycemic agents may be associated with a risk of cancer. These data may suggest that target GA and HbA1c levels should be modified based on patient conditions.
Acknowledgments
We thank all the members and office staff of the JSDT, especially the medical staff of each facility who contributed to the complete annual registry data survey. We also thank all the members of the JSDT Renal Data Registry Committee and all the members of the subcommittee for Scientific Research of the JSDT.
References
Supplementary materials
Supplementary Data
This web only file has been produced by the BMJ Publishing Group from an electronic file supplied by the author(s) and has not been edited for content.
Footnotes
Contributors JH designed the study, analyzed the data, and wrote the initial draft of the manuscript. MA, THam and THas contributed to the analysis and interpretation of the data. AW prepared the dataset. SN, IM, KN and all members of the committee contributed to the design of the study and data interpretation. All authors approved the final version of the manuscript.
Funding This study was supported in part by JH’s research grant from the Okinaka Memorial Institute for Medical Research.
Competing interests None declared.
Patient consent for publication Not required.
Ethics approval This study was approved by the Institutional Review Board of the Japanese Society for Dialysis Therapy, Tokyo, Japan (approval number 30), and the procedures fully adhered to the Declaration of Helsinki.
Provenance and peer review Not commissioned; externally peer reviewed.
Data availability statement Data are available upon reasonable request. Data may be available after permission from the Japanese Society for Dialysis Therapy.