Article Text

Abstract
Introduction Small fiber neuropathy (SFN) is an early manifestation in diabetic polyneuropathy (DPN); however, the mechanisms are not fully understood. In diabetes, SFN is presumed to be common in individuals with overt DPN, enhancing activation of polyol pathway, oxidative stress, advanced glycation end products (AGEs), and inflammation. We explored the relationship between clinicohematological factors related to DPN and pain sensation in the Japanese population.
Research design and methods We conducted a population-based study, recruiting 1030 individuals (average age 54.4±0.5 years), in 2017, to participate in our Iwaki project. After initial screening by fasting blood glucose and glycohemoglobin A1c (HbA1c) measurements, the subjects were categorized into control (n=894), type 2 diabetes (n=81), and impaired fasting glucose (n=55) groups. Clinical data were gathered, and relationships between pain threshold from intraepidermal electrical stimulation (PINT) and DPN were examined by analysis of variance, post hoc test, and χ2 tests to study correlations among and between groups of the clinical data and DPN.
Results Univariate linear regression analyses showed significant correlations between PINT and serum lipopolysaccharide-binding protein (LBP) level (ß=0.1025, p=0.001). Adjustments for the clinical measurements confirmed a positive correlation (ß=0.070, p=0.034). Logistic regression analysis revealed high LBP value (>6.7 mg/dL) as a significant risk factor toward abnormal PINT (≥0.35 mA). LBP significantly correlated with the high-sensitivity C reactive protein, inflammation marker, elevated similarly in both pre-diabetic and overt-diabetic groups, compared with controls, but it did not correlate with a decreased Achilles tendon reflex. In contrast, urine 8-hydroxy-2'-deoxyguanosine, oxidative stress marker, and pentosidine, AGEs, markedly increased in individuals with type 2 diabetes with high HbA1c.
Conclusions Individuals with high LBP exhibited an elevated PINT in the Japanese population. Low level of inflammation evoked by metabolic endotoxemia is possibly implicated in the pathophysiology of SFN from pre-diabetic stage.
- diabetic neuropathies
This is an open access article distributed in accordance with the Creative Commons Attribution Non Commercial (CC BY-NC 4.0) license, which permits others to distribute, remix, adapt, build upon this work non-commercially, and license their derivative works on different terms, provided the original work is properly cited, appropriate credit is given, any changes made indicated, and the use is non-commercial. See: http://creativecommons.org/licenses/by-nc/4.0/.
Statistics from Altmetric.com
Significance of this study
What is already known about this subject?
Pain threshold from intraepidermal electrical stimulation (PINT) is a new non-invasive, quantitative method for the evaluation of small fiber neuropathy (SFN) .
Although the pathophysiology of SFN is assumed to be common with diabetic polyneuropathy, it is not fully understood.
What are the new findings?
Serum lipopolysaccharide-binding protein (LBP) significantly correlated with PINT indices in the general Japanese population.
Mild, but continuous, inflammation exerted by metabolic endotoxemia might be implicated in the pathophysiology of SFN from pre-diabetic stage.
How might these results change the focus of research or clinical practice?
LBP is a surrogate marker for SFN; thus, it can be used to monitor the progression of SFN.
Improvement of lifestyle from pre-diabetes is essential to ameliorate SFN through the suppression of metabolic endotoxemia.
Introduction
Small fiber neuropathy (SFN) is a peripheral nerve disorder characterized by the dysfunction exclusively in small fibers.1 Small nerve fibers consist of the myelinated Aδ fibers and unmyelinated C fibers. In somatic nerve systems, these fibers sprout into the epidermis of the individual, causing temperature sensitivity and tremendous cognizant pain after thermal or mechanical stimulation of the skin.2 SFN manifests a variety of protean symptoms as chronic and diffuse pain, paresthesia and dysesthesia; however, the condition could also be asymptomatic, displaying no pain experience, reduced pain, or temperature sensation.1
It is well known that a close relationship exists between SFN and glucose intolerance, as 36.5% idiopathic neuropathy shows abnormal glucose metabolism.3 Symptoms of the earliest form of diabetic polyneuropathy (DPN) could be as apparent as those of SFN, because DPN is a sensory and distal dominant, ‘dying back’ type of neuropathy.4 The radical treatment of advanced-stage DPN, in which large fibers are also abolished, is not established, and it is well known that the reduction of small fibers could be reversible with strict glycemic control.5 6 This suggests that the initial mechanisms leading to SFN manifestation might change during the progression into established DPN, which includes symptoms of large fiber neuropathy. Therefore, knowing the factors which accumulate during DPN progression is important.
Currently, SFN could be evaluated quantitatively by either invasive or non-invasive methods.7 8 We previously evaluated subjects with SFN in glucose tolerable and impaired fasting glucose (IFG) in the general Japanese population, employing a new electrode for intraepidermal electrical stimulation (IES).9 10 We clarified that a normal-high glycohemoglobin A1c (HbA1c) level correlated with increased pain threshold from intraepidermal electrical stimulation (PINT). Also, we found a significant increase in PINT in patients with DPN, compared with those without DPN.11 12 Diabetic state activates specific pathways which aggravate DPN, including hyperactivation of the polyol pathway, formation and signaling of advanced glycation end products (AGEs), protein kinase C (PKC) activation, oxidative stress, and inflammation.4 Considering the fact that SFN is an initial manifestation of DPN, those mechanisms might also be differently involved in diabetic SFN from developed DPN. Nevertheless, how and to what extent those factors are implicated in the progression of SFN is not clarified fully.
In this study, we evaluated PINT in a general Japanese population that included individuals with IFG and overt diabetes. Also, we determined the clinicohematological factors which might reflect the pathophysiology of SFN, based on IES screening indices.
Research design and methods
Study participants and demographics
The Iwaki study is a health promotion study of Japanese individuals over 10 years of age. This health evaluation in 2017 was conducted with the voluntary participants living in Iwaki, located in northern Japan, a suburban area of Hirosaki City in Aomori Prefecture, comprising mainly of farmland.13 14 For this study, 1073 volunteers (n=1073) were originally present, of whom the following were excluded: 5 with incomplete clinical data, 36 with no PINT measurement, and 2 with no validated PINT results. Thus, the total number of examined individuals (n)=1030 (sex: men, n=425; women, n=605); mean age: 54.4±0.5 years (figure 1).

Subject selection. A total of 1030 participants (425 men and 605 women), out of 1073 volunteers from the Iwaki Study 2017 were eligible in this study. The participants were further classified into normoglycemic subjects (control), T2DM-S, and IFG-S. T2DM-S was further divided into T2DM-L and T2DM-H based on HbA1c value. HbA1c, glycohemoglobin A1c ; IFG, impaired fasting glucose subject; IFG-S, impaired fasting glucose subject; PINT, pain threshold from intraepidermal electrical stimulation; T2DM, type 2 diabetes mellitus, T2DM-H, T2DM HbA1c high group; T2DM-L, T2DM HbA1c low group; T2DM-S, type 2 diabetes mellitus subject.
Categorization of participants
After the initial determination of fasting blood glucose (FBG) and HbA1c, we categorized them into fasting normoglycemic (control, n=894) subjects, subjects with overt diabetes with a history of diabetes, including those undergoing diabetic therapy (type 2 diabetes mellitus subject (T2DM-S), n=81) and subjects with IFG but no history of diabetes (impaired fasting glucose subject (IFG-S)) (n=55) according to the Japan Diabetes Society criteria15 and HbA1c (the National Glycohemoglobin Standardization Program) value, respectively, as follows:
Normoglucose metabolism (control, n=894): FBG <110 mg/dL, and HbA1c <6.5%
IFG (IFG-S, n=55): FBG=110–125 mg/dL and HbA1c <6.5%
Type 2 diabetes (T2DM-S, n=81): FBG ≥126 mg/dL or HbA1c levels ≥6.5%
To explore the involvement of diabetic burden in altered PINT, we further divided the T2DM-S individuals into two groups, T2DM HbA1c low group (T2DM-L) and T2DM HbA1c high group (T2DM-H) based on the value of HbA1c as follows:
T2DM-L (n=62) : HbA1c<7.5%
T2DM-H (n=19) : HbA1c ≧ 7.5%
Subsequently, their relatedness with the clinical measurements and PINT values was examined.
Participants detailed clinical history and also aided in precise classification of the groups. Because T2DM-Ss received medication for diabetes, measured blood glucose levels could be within the normal range. Even if so, they were considered diabetic and included in the study. Participants' demographic and baseline clinical characteristics are summarized in figure 1.
Clinical profiles
Blood samples were collected in the mornings, under fasting conditions, from peripheral veins while in a supine position. The following clinical measurements were recorded: height, body weight, body mass index (BMI), body fat mass (%), and waist circumference. Measurements of glucose metabolism included FBG, HbA1c, fasting serum insulin levels (F-IRIs), and C-peptide. For the determination of lipid metabolism, serum levels of tryglyceride (Tg), total cholesterol (Tc), high-density lipoprotein cholesterol (HDL-c) and low-density lipoprotein cholesterol (LDL-c) were measured. For the determination of AGEs, serum levels of pentosidine were measured. For the determination of inflammation marker, serum interleukin-6 (IL-6), high-sensitivity C reactive protein (Hs-CRP), adiponectin, and lipopolysaccharide-binding protein (LBP) were measured by enzyme immunoassay (IL-6 and LBP), nephelometry method (Hs-CRP) and latex immunoturbidimetric method (adiponectin), respectively. As the markers for oxidative stress and anti-oxidative stress, Urine 8-hydroxy-2'-deoxyguanosine (8-OHdG), and vitamin A, C, and E, Lutein, zeaxantihin, β-cryptoxanthin, α-carotene, β-carotene, and lycopene. Subjective symptoms for neuropathy were also determined by questionnaires and the history of medication, evaluated in Iwaki projects. Adipose tissue volume was measured by the bioelectricity impedance method using a Tanita MC-190 body composition analyzer (Tanita Corporation, Tokyo, Japan). Achilles tendon reflex (ATR) was scored, based on two titer systems: score 0, areflexia/hyporeflexia; score 1, normal/hyper-reflexia.
Subjective neuropathic foot symptoms (pricking, burning, and aching pains) were determined from the questionnaires. Indices of insulin resistance and secretion were assessed by employing a homeostasis model using FBG and insulin levels (HOMA-IR and HOMA-ß), respectively. None of the participants were diagnosed with type one diabetes or inherited diseases that affected the HbA1c measured values.
PINT measurement
For nociceptive stimulation, IES method was adopted using a disposable concentric bipolar needle electrode (NM‐983W; Nihon Kohden Corporation, Tokyo, Japan), connected to a specific stimulator for cutaneous Aδ and C fibers, as previously described (PNS-7000, Nihon Kohden).12 The stimulator consisted of an outer ring anode (1.3 mm diameter) and the cathode of an inner needle that protruded 0.025 mm from the level of the outer ring. IES electrode was placed onto the skin of the instep (over the extensor digitorum brevis) to deliver weak continuous electrical stimulations. This stimulation can evoke a local pricking sensation. In instances where the keratinized layer of the skin was too thick and likely to interrupt the electronic stimulation, the electrode was moved elsewhere on the same foot to locate an area of seemingly no thick layer. The participants were instructed to push the button as quickly as possible only when they felt a sensation. Stimulation intensity was decreased by 0.05 mA stepwise from 0.4 mA until the participants reported a pricking sensation. The current intensity is directly proportion to the intensity of stimulation. PINT was defined as the minimum intensity at which the participants felt a pricking sensation in more than two trials. Therefore, PINT can basically evaluate the degrees of hypoalgesia toward electrical pain stimulation.
Statistical methods
The values of the clinical measurements were expressed as means±SEM. The statistical significance of the differences in values between two groups (parametric) and case–control associations among groups (non-parametric) was assessed using an analysis of variance with a post hoc test, followed by Bonferroni’s corrections and χ2 tests, respectively. Correlations between PINT values and clinical parameters, including age (years), BMI, fat amount (%), waist circumference (cm), FBG (mg/dL), HbA1c (%), F-IRI (μU/mL), C-peptide (ng/mL), HOMA-β, HOMA-IR, Tg (mg/dL), Tc (mg/dL), HDL-c (mg/dL), LDL-c (mg/dL), pentosidine (pmol/mL), IL-6 (pg/mL), Hs-CRP (mg/dL), adiponectin (μg/mL), LPB (µg/mL), urine 8-OHdG (ng/mL·Cr), vitamin A (μg/mL), vitamin C (μg/mL), vitamin E (μg/mL), lutein (μg/mL), zeaxantihin (μg/mL), β-cryptoxanthin (µg/mL), α-carotene (µg/mL), β-carotene (µg/mL), lycopene (µg/mL), decreased ATR, and subjective symptoms were assessed by linear regression analyses. For the statistical analyses to examine the correlation between glycemic variability and DPN, HbA1c was log-transformed (log10) to approximate a normal distribution. The risk of higher serum LBP with increased PINT indices was calculated by multiple logistic regression analysis with an adjustment for factors identified to associate with PINT indices by univariate regression analysis and potentially confounding variables for SFN from a previous study.11 For the calculation of ORs, SFN was designated as 0.35 mA and higher. A value of p<0.05 was regarded as statistically significant. All analyses were performed using Jmp V.10.0.4 and StatView V.5.0.1.
Results
Participants’ clinical profile and demographic correlations
Clinical profiles of the participants are displayed in online supplemental table 1. The distribution of control, IFG-S, T2DM-L, and T2DM-H were similar between men and women. The mean age was 54.1±0.8 years for men and 54.6±0.6 years for women. FBG and C-peptide were elevated (FBG: 98.63±0.94 vs 92.36±0.53 mg/dL, C-peptide: 1.44±0.04 vs 1.27±0.02 mg/dL). Serum Tg was higher and HDL-c levels were lower in the men (Tg: 123.83±4.40 vs 81.18±1.76 mg/dL; HDL-c: 59.25±0.81 vs 70.12±0.66 mg/dL). Adiponectin levels were lower in the men, while LBP was moderately higher in the women (adiponectin: 8.56±0.20 vs 13.37±0.27 mg/mL, and LBP: 5.93±0.08 vs 5.68±0.07 µg/mL). Urine 8-OHdG, used as a marker for oxidative stress, was higher in the women (8.62±0.17 vs 9.41±0.19 ng/mL·Cr). The antioxidative stress substances were higher in the women, except for vitamin A (vitamin A: 0.53±0.01 vs 0.40±0.01 µg/mL, vitamin C: 10.15±0.19 vs 12.85±0.18 µg/mL, lutein: 0.25±0.01 vs 0.28±0.01 µg/mL, β-cryptoxanthin: 0.11±0.01 vs 0.16±0.01 µg/mL, α-carotene: 0.12±0.01 vs 0.16±0.01 µg/mL, β-carotene: 0.27±0.01 vs 0.50±0.01 µg/mL, lycopene 0.22±0.01 vs 0.24±0.01 µg/mL). The prevalence of decreased ATR (24.53 % and 15.65 %) and subjective neuropathic symptoms measurements (3.07 % and 2.31 %) were comparable between men and women, respectively.
Supplemental material
Correlation between PINT indices and the molecules relating to DPN pathogenesis
A univariate regression analysis revealed a close correlation between the PINT values and clinical measurements, such as age, BMI, fat amount, waist circumference, FBG, HbA1c, F-IRI, C-peptide, HOMA-IR, LBP, urine 8-OHdG and decreased ATR (table 1).
Clinical factors correlated with PINT indices
The correlation between PINT and LBP remained significant after adjustment for multiple factors (age, BMI, fat amount, waist circumference, FBG, HbA1c, F-IRI, C-peptide, HOMA-IR, urine 8-OHdG, and decreased ATR) (ß=0.07, p=0.034). These correlations remained significant after adjustment for gender and age (LBP: ß=0.069, p=0.027) (online supplemental table 2).
Risk ratio of serum LBP level to increased PINT indices
The correlation between LBP levels and PINT indices was assessed further with stratification of the subjects into tertiles based on the LBP levels (low <4.6 mg/dL (lipopolysaccharide-binding protein low (LBP-L)), middle 4.6–6.7 mg/dL (lipopolysaccharide-binding protein medium (LBP-M)), and high <6.7 mg/dL (lipopolysaccharide-binding protein high (LBP-H)) (figure 2). The PINT value in LBP-H was significantly higher than that in LBP-L (p<0.05) (figure 2A). Hs-CRP, HbA1c, FBG, and BMI were gradually increased in proportion to the level of LBP (figure 2B–E). HOMA-IR showed a similar tendency to other factors relating to glucose metabolism (figure 2F). The highest value of HOMA-IR was observed in the LBP-H among all the groups. Then, the risks of these tertiles were calculated toward increased PINT index (figure 3). High and moderate serum LBPs were a significant risk factor for increased PINT (OR 2.67, 95% CI 1.42 to 5.26, and OR 2.21, 95% CI 1.24 to 4.19, respectively), if SFN was designated as 0.35 mA and more (figure 3A). The risk remained significant after adjustment for multiple factors in LBP-H and LBP-M (age, HbA1c, FBG, F-IRI, C-peptide, BMI, waist circumference, fat amount, urine 8-OHdG, and decreased ATR) (OR 2.21, 95% CI 1.08 to 4.72 and OR 2.00, 95% CI 1.07 to 3.80) (figure 3B). The risks of these LBP tertiles toward other neuropathic measures, such as subjective symptoms and decreased ATR, were also calculated (figure 3C,D). High LBP level was not a significant risk factor for both subjective symptoms and decreased ATR (OR 1.73, 95% CI 0.63 to 5.15, and OR 0.90, 95% CI 0.58 to 1.41).
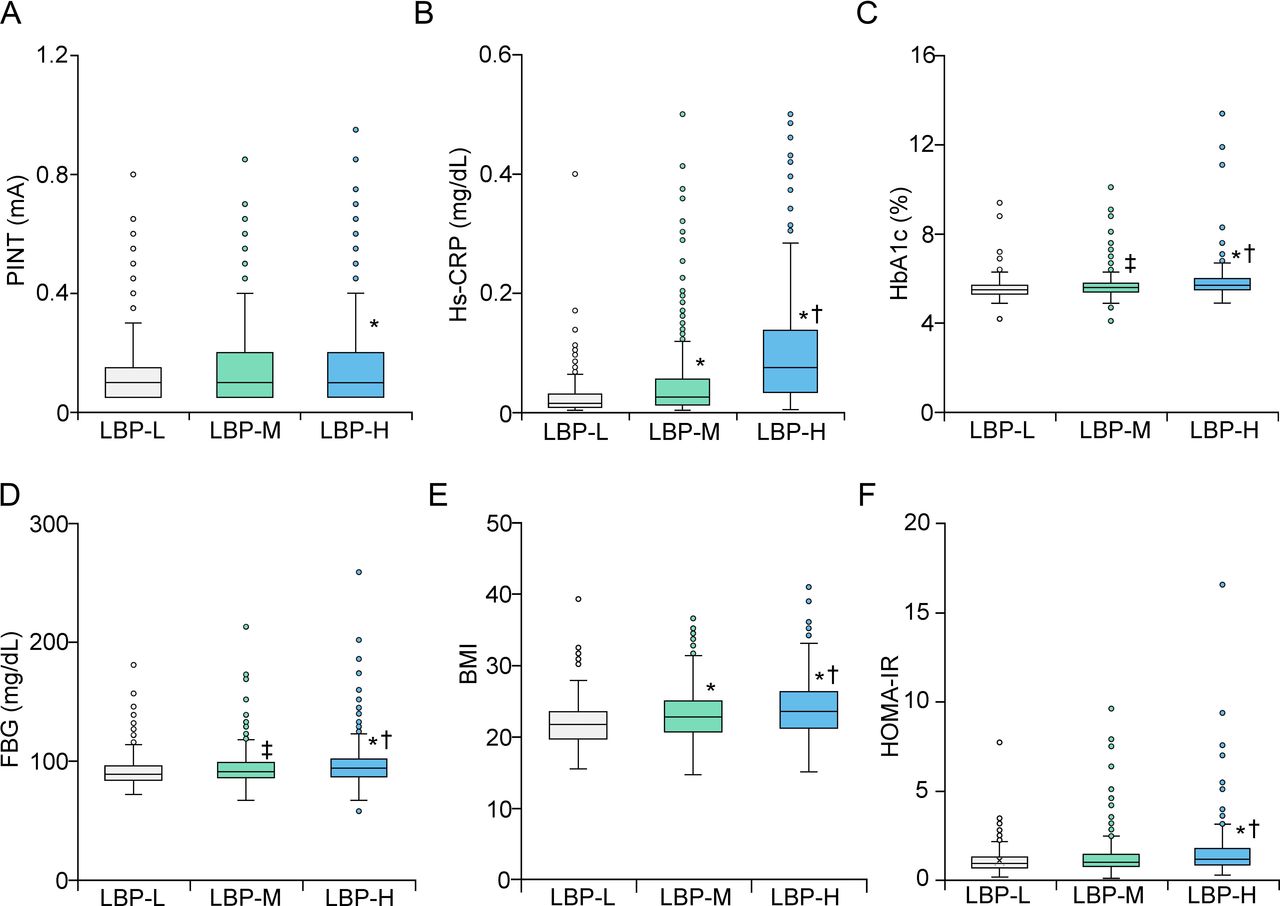
Metabolic parameters in each group of graded LBP. PINT indices were significantly high in LBP-H, compared with LBP-L (A). Hs-CRP, HbA1c, FBS and BMI were proportionally correlated with LBP level (B–E). HOMA-IR was significantly high in LBP-H, compared with other groups (F). *P<0.01 vs LBP-L, †P<0.01 vs LBP-M, ‡P<0.05 vs LBP-L. BMI, body mass index; FBG, fasting blood glucose; HbA1c, glycohemoglobin A1c; HOMA-IR, homeostatic model assessment insulin resistance; Hs-CRP, high-sensitivity C reactive protein; LBP, lipopolysaccharide-binding protein; LBP-H, lipopolysaccharide-binding protein high; LBP-L, lipopolysaccharide-binding protein low; LBP-M, lipopolysaccharide-binding protein medium; PINT, pain threshold from intraepidermal electrical stimulation.

Logistic analysis of clinical measures at risk of increased PINT indices. ORs and 95% CIs for LBP (A,B) are shown. Multiple factors at risk of correlation increased PINT in the correlation analysis are age, BMI, fat amount, waist circumference, FBG, HbA1c, F-IRI, C-peptide, HOMA-IR, urine 8-OHdG and decreased ATR. ORs with 95% CIs for subjective symptoms and decreased ATR are shown (C,D). ATR, Achilles tendon reflex; BMI, body mass index; CI, confidence interval; FBG, fasting blood glucose; F-IRI, fasting serum insulin level; HbA1c, glycohemoglobin A1c; HOMA-IR, homeostatic model of insulin resistance; LBP, lipopolysaccharide-binding protein; LBP-H, lipopolysaccharide-binding protein high; LBP-L, lipopolysaccharide-binding protein low; LBP-M, lipopolysaccharide-binding protein medium; 8-OHdG, 8-hydroxy-2'-deoxyguanosine; OR, Odds ratio; PINT, pain threshold from intraepidermal electrical stimulation; Ref., reference.
Correlation between diabetic state and the measurements implicated in the pathogenesis of DPN
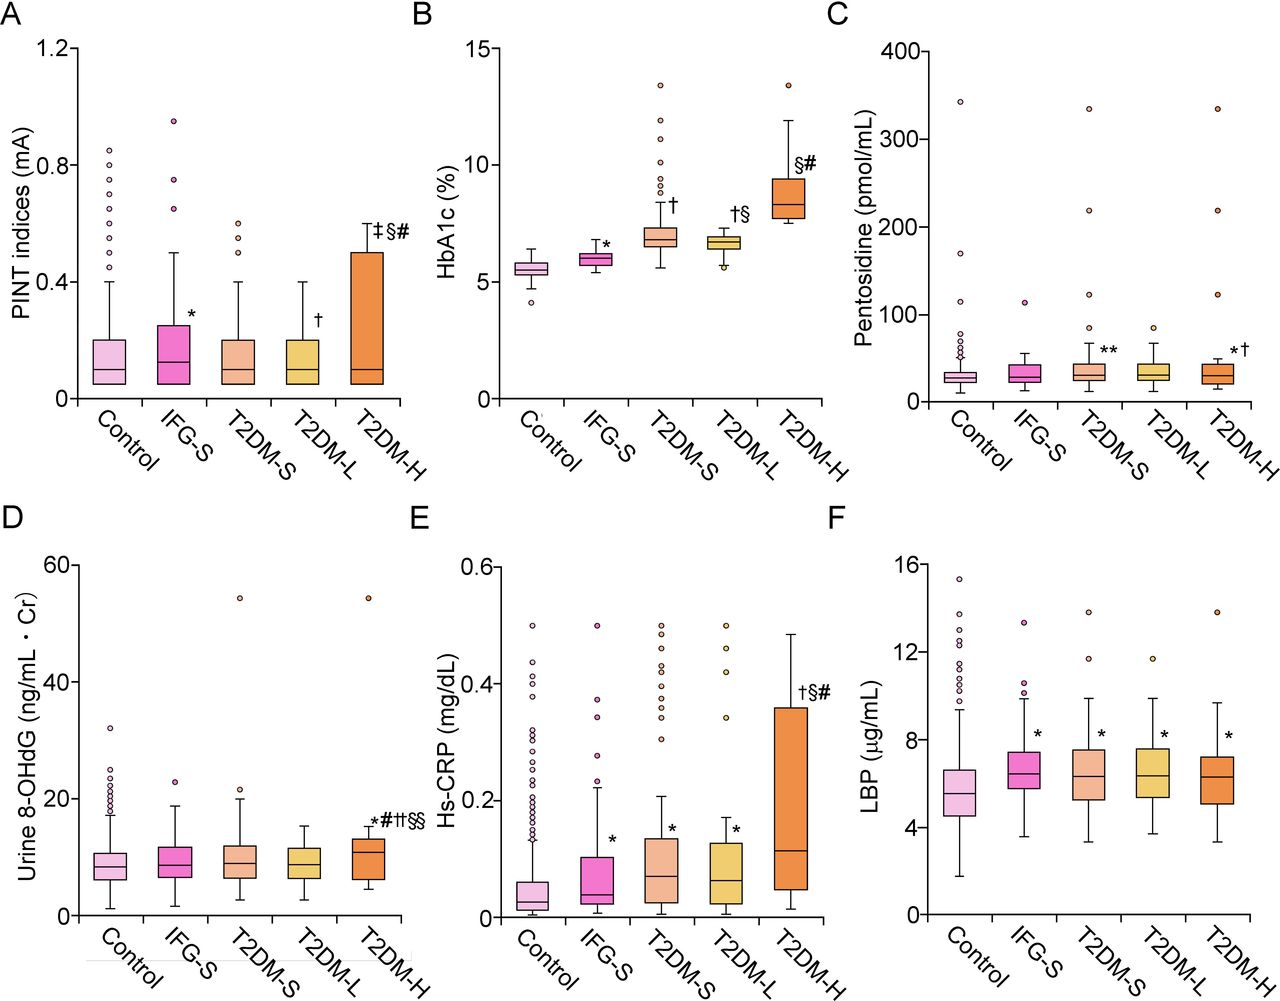
PINT indices of IFG-S were significantly high, compared with those of control (p<0.01) (figure 4A). In contrast, PINT indices of T2DM-S and T2DM-L were comparable with those of control, while those of T2DM-H were significantly high, compared with those of control (p<0.001). Serum HbA1c levels increased gradually, according to diabetes progression (figure 4B). Pentosidine was comparable between control, IFG-S, and T2DM-L, while T2DM-S showed higher value than control (p<0.05) (figure 4C). Pentosidine in T2DM-H was markedly elevated, compared with that of IFG-S and control (p<0.01). Urine 8-OHdG level of IFG-S, T2DM-S, and T2DM-L was comparable to that of Control, while T2DM-H showed a significantly high value than that of remaining groups (p<0.01 vs control and T2DM-L, p<0.05 vs IFG-S and T2DM-S) (figure 4D). Hs-CRP significantly increased in IFG-S and both of the T2DM groups, compared with the control (p<0.01) (figure 4E). In particular, T2DM-H showed a profound increase in Hs-CRP, compared with the remaining groups (vs IFG-S and T2DM-L, p<0.01). In contrast, LBP was similarly high in all pre-diabetic and diabetic groups compared with the control (p<0.01) (figure 4F).
Pathological factors for DPN in each group of graded precipitants according to glucose metabolism. PINT indices were significantly high in IFG compared with control. T2DM-H showed the highest PINT indices among the examined groups (A). HbA1c was gradually increased in line with the attenuation of glucose tolerance (B). Pentosidine and urine 8-OHdG was significantly increased in T2DM-H (C,D). Hs-CRP was mildly increased in IFG and T2DM-L, while Hs-CRP was dramatically increased in T2DM-H (E). LBP was similarly increased in IFG and overt diabetic groups compared with control (F). *P<0.01 vs control, †P<0.01 vs IFG-S, ‡P<0.001 vs control, §P<0.01 vs T2DM-S, #P<0.01 vs T2DM-L, **P<0.05 vs control, ††P<0.05 vs IFG-S, §§P<0.05 vs T2DM-S. DPN, diabetic polyneuropathy; HbA1c, glycohemoglobin A1c ; Hs-CRP, high-sensitivity C reactive protein; IFG, impaired fasting glucose; IFG-S, impaired fasting glucose subject; LBP, lipopolysaccharide-binding protein; 8-OHdG, 8-hydroxy-2'-deoxyguanosine; PINT, pain threshold from intraepidermal electrical stimulation; T2DM-H, T2DM HbA1c high group; T2DM-L, T2DM HbA1c low group; T2DM-S, type 2 diabetes mellitus subject.
The detailed profiles of therapeutic history are shown in online supplemental table 3. When the history of incretin-related agents (IRAs) was compared with that of non-IRA, the history of IRA was significantly higher in T2DM-L than T2DM-H (online supplemental table 4). No difference was found in PINT indices according to the history of IRA therapy in T2DM-L (online supplemental figure 1).
Supplemental material
Discussion
In our current study, we clarified the significant correlation between PINT indices and LBP in both univariate and multivariate regression analyses. The level of LBP significantly correlated with the parameters associated with glucose metabolism. Also, we validated that PINT values increased in IFG-S, compared with control subjects, while those of the type 2 diabetic group were not. With the stratification of the type 2 diabetic group, T2DM-H showed a marked increase in PINT values, compared with the control, but not T2DM-L. Hs-CRP, pentosidine, and urine 8-OHdG were markedly increased in T2DM-H compared with the remaining groups. In contrast, LBP was increased similarly in all subjects with pre-diabetes and diabetes, compared with the control.
Generally, LBP is considered as a surrogate biomarker for the activation of lipopolysaccharide (LPS)-induced innate immune responses.16 17 LPS is known to trigger a variety of inflammatory reactions through Toll-like receptor 4 (TLR4) in response to the infection.18 Recent evidence also indicates that metabolic disturbances like obesity or type 2 diabetes can increase serum LPS level, known as metabolic endotoxemia.19 Elzinga et al reported the implication of the TLR2/4 pathway in DPN.20 DPN was partially protected in high-fat diet fed to TLR2/4 knocked out mice during its early time point. Similar to the report, our results also suggest that metabolic endotoxemia could be involved in the onset and progression of SFN from the pre-diabetic stage. Although the change of intestinal bacterial flora in DPN is still unclarified, an intervention of lifestyle habit to correct it is a possible therapeutic target for SFN in pre-diabetes.
Recently, several studies in humans demonstrated that serum LBP levels were closely associated with type 2 diabetes and its complications.21 22 Similarly, our results showed that the measurements reflecting glucose metabolism that was particularly associated with insulin resistance increased proportionally with LBP. As a biomarker for LPS-induced innate immune responses, LBP level was positively correlated with Hs-CRP level in our data. On the other hand, differently from Hs-CRP, LBP was not directly proportional to the progression of diabetes. These findings indicate that metabolic endotoxemia could facilitate mild inflammation continuously from the pre-diabetic stage and that additional mechanisms accelerate the inflammatory reaction in advanced diabetic conditions. Previous studies found the implication of polyol pathway, AGEs, PKC activation, inflammation, and oxidative stress in DPN progression.4 Our results could suggest that mild inflammation exerted by metabolic endotoxemia is not sufficient to exacerbate large fiber neuropathy. An additional contribution of AGEs and a more severe oxidative stress on metabolic endotoxemia might be an essential prerequisite for the establishment of DPN with large fiber symptoms.
In this study, we comprehensively evaluated the molecules relating to anti-oxidative or pro-oxidative stress in the blood. The molecules of anti-oxidative stress were not correlated with PINT indices and diabetic state, while 8-OHdG was correlated with PINT in univariate analysis and significantly increased in T2DM-H. Ziegler et al reported that markers of anti-oxidant defense were decreased in the DPN group compared with the control group.23 In that study, DPN was diagnosed according to nerve conduction velocities and vibration threshold perception tests without objective quantitative assessment of small fibers. These indicate that anti-oxidant defense of a whole body is intact in the early stage of DPN. The deficit of the anti-oxidant system might become evident in line with the progression of DPN.
Although increased PINT was known in patients with diabetes, particularly in the subjects with neuropathy,11 12 no data regarding the correlation between PINT indices and HbA1c in subjects with diabetes were presented. Interestingly, we disclosed the derangement of pain sensation in the participants with IFG, but not in the T2DM-L group. HbA1c value in T2DM-L was high compared with that in IFG-S, and the level of LBP and Hs-CRP was the same between T2DM-L and IFG-S. These results suggest the presence of possible factors to suppress the development of SFN in T2DM-L other than simple hematological measures.
Close association exists between subjects with SFN and pre-diabetes with reduction of intraepidermal nerve fiber deisnity (IENFD).3 24 There is a possibility that strict glycemic control could revert SFN and IENFD in DPN.5 6 The treatment for type 2 diabetes possibly minimalizes fluctuation and variation of blood glucose after meal ingestion in T2DM-L compared with IFG-S. Glucose fluctuation is known as an exacerbation factor for diabetic complications, including DPN, with an intermittent increase in the generation of reactive oxygen species.25–28 The alleviation of glucose fluctuation may facilitate the regeneration of small fiber in T2DM-L, resulting in the amelioration of PINT indices.
Apart from glucose metabolism, a direct therapeutic effect of oral glucose compounds on SFN may exist, because oral treatment for diabetes experimentally delayed or suppressed the symptom of DPN.29–32 Previous studies suggest the beneficial effects of IRA such as GLP1 receptor agonist or DPP4 inhibitor on DPN regardless of glucose metabolism.33 34 Indeed, the prevalence of incretin-related therapy on T2DM-L was significantly high compared with T2DM-H, while no significant differences of PINT indices were identified with a categorization of T2DM-L based on the history of IRA. Therefore, the history of IRA might have minimum impacts on the improvement of SFN in T2DM-L.
Our study does not preclude limitations: first, this study is based on a single cohort, which consists of volunteers in a health promotion study. Because Iwaki study is basically designed for the healthy subjects, sufficient numbers of subjects with overt diabetes or pre-diabetes do not participate. We need to confirm our results in other cohorts. Second,evaluating nerve conduction velocities, the molecular and pathological changes of the skin or the sural nerve, was impossible, because invasive examinations were not permitted. We would confirm the findings obtained from the clinicohematological examinations in this study by direct evaluation of peripheral nerve function and tissues in the future. Third, we also classified individuals into control, IFG, and type 2 diabetes based on only a single measurement of FBG, HbA1c, and detailed clinical history. Hence, we could not exclude the possibility that subjects with overt type 2 diabetes are contaminated in the IFG or control group if individuals who would only show abnormal glucose tolerance with normal HbA1c and FBG exist. A glucose tolerance test would be required to confirm the diabetic status of our cohort in the future.
In conclusion, our current study showed that serum LBP levels significantly associated with elevated PINT indices in a general Japanese population that include diabetes condition. Metabolic endotoxemia might be an underlying factor of the SFN subjects with pre-diabetes, while other additional pathogenic factors, including oxidative stress and AGEs, are additionally involved in uncontrolled SFN in individuals with type 2 diabetes; thus, we suggest that LBP is indeed a biomarker for SFN in diabetes and metabolic endotoxemia and that it might be a therapeutic target of SFN.
Acknowledgments
Technical assistance from Ms Saeko Osanai, Misato Sakamoto and Hiroko Mori of the Department Pathology and Molecular Medicine of Hirosaki University Graduate of Medicine is highly appreciated.
References
Supplementary materials
Supplementary Data
This web only file has been produced by the BMJ Publishing Group from an electronic file supplied by the author(s) and has not been edited for content.
Footnotes
Contributors KK: conducted the study for the measurement of pain threshold from intraepidermal electrical stimulation (PINT), discussed and interpreted the results, and contributed to drafting the manuscript. HM: designed and conducted the study for the measurement of PINT, discussed and interpreted the results, and contributed to the manuscript draft. CI: conducted the study for the measurement of PINT, and interpreted and discussed the results. NF: conducted the study for the measurement of antioxidant substances, including lipopolysaccharide-binding protein, interpreted and discussed the results. SOs, AI and SOg: conducted the study for the measurement of PINT, and interpreted and discussed the results. KW: conducted the study for the measurement of Achilles tendon reflex, and interpreted and discussed the results. YT, YI, SY and KH: interpreted and discussed the results. SN: designed and conducted the Iwaki study, and interpreted and discussed the results.
Funding This work was supported by JST COI Grant Number JPMJCE1302.
Disclaimer Electrodes for intraepidermal electrical stimulation were supplied by Nihon Kohden Corp, Tokyo, Japan.
Competing interests None declared.
Patient consent for publication Not required.
Ethics approval This study was performed in accordance with the Declaration of Helsinki and was approved by the Ethics Committee of the Hirosaki University School of Medicine (number 2017–026).
Provenance and peer review Not commissioned; externally peer reviewed.
Data availability statement Data are available upon reasonable request. Data used during the study are available from the corresponding author by request.