Article Text

Abstract
Objective The associated risk of vascular disease following diagnosis of type 2 diabetes in people previously identified as having pre-diabetes in real-world settings is unknown. We examined the presence of microvascular and macrovascular disease in individuals with newly diagnosed type 2 diabetes by glycemic status within 3 years before diagnosis.
Research design and methods We identified 159 736 individuals with newly diagnosed type 2 diabetes from the UK Clinical Practice Research Datalink database in England between 2004 and 2017. We used logistic regression models to compare presence of microvascular (retinopathy and nephropathy) and macrovascular (acute coronary syndrome, cerebrovascular and peripheral arterial disease) disease at the time of type 2 diabetes diagnosis by prior glycemic status.
Results Half of the study population (49.9%) had at least one vascular disease, over one-third (37.4%) had microvascular disease, and almost a quarter (23.5%) had a diagnosed macrovascular disease at the time of type 2 diabetes diagnosis.
Compared with individuals with glycemic values within the normal range, those detected with pre-diabetes before the diagnosis had 76% and 14% increased odds of retinopathy and nephropathy (retinopathy: adjusted OR (AOR) 1.76, 95% CI 1.69 to 1.85; nephropathy: AOR 1.14, 95% CI 1.10 to 1.19), and 7% higher odds of the diagnosis of acute coronary syndrome (OR 1.07, 95% CI 1.03 to 1.12) in fully adjusted models at time of diabetes diagnosis.
Conclusions Microvascular and macrovascular diseases are detected in 37%–24% of people with newly diagnosed type 2 diabetes. Pre-diabetes before diagnosis of type 2 diabetes is associated with increased odds of microvascular disease and acute coronary syndrome. Detection of pre-diabetes might represent an opportunity for reducing the burden of microvascular and macrovascular disease through heightened attention to screening for vascular complications.
- pre-diabetes
- microvascular
- macrovascular
- retinopathy
This is an open access article distributed in accordance with the Creative Commons Attribution Non Commercial (CC BY-NC 4.0) license, which permits others to distribute, remix, adapt, build upon this work non-commercially, and license their derivative works on different terms, provided the original work is properly cited, appropriate credit is given, any changes made indicated, and the use is non-commercial. See: http://creativecommons.org/licenses/by-nc/4.0/.
Statistics from Altmetric.com
Significance of this study
What is already known about this subject?
Pre-diabetes has been shown to contribute to the pathogenesis of vascular dysfunction that might partly explain the increased risk of vascular morbidity and mortality in pre-diabetes and type 2 diabetes.
What are the new findings?
Half of the study population (49.9%) had at least one vascular disease.
Compared with individuals with glycemic values within the normal range, those detected with pre-diabetes before the diagnosis had 76% and 14% increased odds of retinopathy and nephropathy, and 7% higher odds of the diagnosis of acute coronary syndrome at time of diabetes diagnosis.
How might these results change the focus of research or clinical practice?
Detection of pre-diabetes might represent an opportunity for reducing the burden of microvascular and macrovascular disease through heightened attention to screening for vascular complications.
Introduction
The effectiveness of identifying individuals with pre-diabetes to prevent type 2 diabetes has been intensely debated.1–4 Clinical trials demonstrating that lifestyle modification and drug-based interventions could prevent or delay progression to type 2 diabetes provide some robust evidence.3 5 However, critics argue that only a subset of individuals with pre-diabetes will develop type 2 diabetes, and the population benefits of intervention are outweighed by the potential negative effects due to over-testing, unnecessary medicalization, and uncertainties in benefits of prevention strategies outside the research environment, among other factors.1 3 6 7 There is also lack of consensus on diagnostic tests and glycemic thresholds for the detection of pre-diabetes.8–11 Various diagnostic criteria have been adopted by different organizations that have been repeatedly revised over time.1 Different diagnostic criteria identify different groups of individuals who differ in progression rates to type 2 diabetes and risk of associated morbidity,12–15 raising the question of whether those who might benefit the most from tight clinical management are effectively identified as high risk by each criterion.3
Pre-diabetes has been shown to contribute to the pathogenesis of macrovascular dysfunction that might partly explain the increased risk of cardiovascular disease morbidity and mortality in pre-diabetes and type 2 diabetes.6 14 16–19 Pre-diabetes is also linked to generalized microvascular dysfunction similar to the vascular damage typical to type 2 diabetes.6 16 20 21 This suggests that the development of type 2 diabetes–associated microvascular disease may precede the clinical diagnosis of type 2 diabetes.22 Early stages of retinopathy, neuropathy, and nephropathy, that are generally milder forms compared with that seen in established type 2 diabetes, have been reported in people with pre-diabetes,6 21 23 and prevention studies have demonstrated that their risk can be reduced with lifestyle interventions.24 This may have important implications for preventive strategies, and whether glycemic testing and detection of pre-diabetes in real-world settings affect the development of microvascular and macrovascular disease among individuals who subsequently develop type 2 diabetes.
Our study aims to examine whether the occurrence of vascular disease differs in individuals newly diagnosed with type 2 diabetes with prior pre-diabetes compared with those with normal glycemic levels in real-world settings. We assessed this using different diagnostic criteria currently applied to pre-diabetes.
Methods
Study population
We used data from the UK Clinical Practice Research Datalink (CPRD), one of the largest databases of electronic medical records globally.25 CPRD holds anonymized routinely collected longitudinal primary care records, covering approximately 7% of the UK population and it is representative in terms of age and sex.25 26 We defined a cohort of individuals who were newly diagnosed with type 2 diabetes between January 1, 2004 and September 30, 2017. Participants included in the cohort were registered with one of the 75% of CPRD practices with linked hospital admission and mortality data. Participants also had to have been continuously registered with a practice for at least 1 year before the diagnosis of type 2 diabetes and with availability of historical data in clinical records. Diagnoses of type 2 diabetes were identified using both diagnostic (C10) and management (66A) codes for type 2 diabetes in primary care records based on an established method.27 Individuals who were diagnosed with type 2 diabetes under the age of 35 years who were prescribed insulin within 3 months of diagnosis and who were not prescribed oral hypoglycemic agents for longer than 3 months were excluded because these individuals were likely to have type 1 diabetes.28 As our study focuses on detection of pre-diabetes before type 2 diabetes diagnosis, individuals who had glycemic values within the diabetes range recorded more than 3 months before the date of the first diagnosis of type 2 diabetes were excluded from this study, as in this case testing might not be attributable to the diagnostic process but to misclassification. A study diagram summarizing inclusion and exclusion criteria is shown in online supplementary figure S1.
Supplemental material
Detection of pre-diabetes in primary care settings
For the detection of pre-diabetes, we used diagnostic criteria published by WHO and International Expert Committee (IEC): fasting plasma glucose (FPG) 6.1–6.9 mmol/L; oral glucose tolerance test (OGTT) 7.8–11.1 mmol/L; HbA1c 42 to 47 mmol/mol or 6.0%–6.4%.10 29 To identify glycemic values within the pre-diabetes range, we used all available clinical data within 3 years before the date of type 2 diabetes diagnosis considering that among the majority of individuals progressing to type 2 diabetes, a marked increase in glycemic levels is observed within 2 to 3 years before the diagnosis of type 2 diabetes.6 30 Individuals with multiple glycemic recordings were classified as having pre-diabetes if at least one measurement met the detection criteria for pre-diabetes. We also used diagnostic codes in primary care records for impaired fasting glucose, impaired glucose tolerance, or other (eg, “Non-diabetic Hyperglycaemia” or “Intermediate Hyperglycaemia”) to identify pre-diabetes cases. In case of multiple records over time, the date of the earliest available pre-diabetes detection was used. Individuals were classified as (1) glycemic values within the normal range before type 2 diabetes diagnosis, (2) pre-diabetes detected before type 2 diabetes diagnosis, or (3) no glycemic measures recorded within 3 years before type 2 diabetes diagnosis.
Study outcomes
Study outcomes included the diagnosis of microvascular (retinopathy and nephropathy) and macrovascular diseases (cerebrovascular disease, acute coronary syndrome, and peripheral arterial disease) at the time of diagnosis of type 2 diabetes. Diagnoses were defined based on the combination of laboratory tests, diagnostic codes in primary care records, and ICD-10 codes on hospital admissions (see online supplementary table S2). Microvascular disease at the time of the diagnosis was defined by the recording of a microvascular disease within 5 years before or 15 months after the diagnosis of type 2 diabetes.31 The 15-month period was defined based on the time periods of specific process of care indicators of the Quality and Outcomes Framework (QOF) for diabetic retinopathy screening and urine microalbumin testing (12 months and 15 months, respectively).32 Macrovascular disease at time of diagnosis was defined by the recording of a macrovascular disease any time before or within 1 year of the diagnosis of type 2 diabetes.
Study covariates
Study covariates included age, sex, ethnicity, smoking status, blood pressure (systolic and diastolic), body mass index (BMI), total cholesterol, number of diagnosed comorbid conditions (considering a previously published list33), prescription of anti-hypertensive (ACE inhibitor (ACEi) or angiotensin receptor blocker (ARB); others), anti-platelet, lipid-lowering, and anti-diabetic medications (biguanides, sulfonylureas, insulin, others) and number of primary care visits during the year before the diagnosis of type 2 diabetes and quintile of the index of multiple deprivation (IMD) at practice level.34 Information on covariates was collected in the year following the diagnosis of type 2 diabetes. In case of multiple measurements for the same individual, the mean value was calculated for continuous variables and the latest data recorded within the year were used for binary variables. To reduce missing data for study covariates in the year following the diagnosis of type 2 diabetes, we used the latest clinical recording for individuals with missing values within 5 years before the start of the study period.35–37 Individuals with missing data on smoking were classified as non-smokers if there was no indication in the past of the individual being a smoker.35 36
Secondary analyses
We undertook two secondary analyses. The first secondary analysis compared results obtained adopting diagnostic criteria for the detection of pre-diabetes published by WHO/IEC with those obtained using those published by the American Diabetes Association (ADA; FPG 5.6–6.9 mmol/L; OGTT 7.8–11.1 mmol/L; HbA1c 39 to 47 mmol/mol or 5.7%–6.4%) and the UK National Institute for Health and Care Excellence8 (NICE; FPG 5.5–6.9 mmol/L; OGTT 7.8–11.1 mmol/L; HbA1c 42 to 47 mmol/mol (6.0%–6.4%)) (see online supplementary table S2). An additional secondary analysis was undertaken to explore whether among individuals with pre-diabetes clinical outcomes differed according to whether diagnostic coding for pre-diabetes in electronic health records was assigned following the detection of pre-diabetes. Assigning a diagnostic code for pre-diabetes might be associated with a more intensive clinical management of cardiovascular risk factors among individuals who were classified as having pre-diabetes. Analysis was undertaken using various diagnostic criteria (WHO/IEC, ADA, and NICE) for pre-diabetes.
Statistical analysis
Missing data were present for blood pressure (0.5%), BMI (2.8%), total cholesterol (7.0%), and HbA1c (24.1%). We conducted a missing pattern analyzing employing logistic regression analyses and using graphical tools and we concluded that missing data were at random (data not shown).38 Therefore, we used multiple imputation by chained equations (10 copies) to estimate missing data for these variables. We included the following variables in the imputation model as likely to be associated with recording of risk factors: age, sex, ethnicity, smoking status, number of diagnosed comorbid conditions, number of primary care consultations in the year before the diagnosis of type 2 diabetes, general practice IMD, presence of acute coronary syndrome, cerebrovascular and peripheral arterial disease, and prescription of ACEi or ARB, lipid-lowering, and anti-diabetic medications.
We compared population characteristics according to glycemic status before the diagnosis of type 2 diabetes (pre-diabetes, normal glycemic status, and not recorded) using χ2 test and ANOVA, as appropriate. Multivariable logistic regression models were employed to assess the odds of having microvascular and macrovascular disease at the time of type 2 diabetes diagnosis in individuals with pre-diabetes and those without glycemic measures recorded compared with individuals with normal glycemic values before the diagnosis of type 2 diabetes. HbA1c was excluded as covariate from the statistical models because the pre-diabetes definition is based on glycemic values. Other variables were tested for multicollinearity calculating the variance-inflation factor and correlation coefficients. Thus, BMI and the use of medications were also excluded due to collinearity with pre-diabetes and other risk factors. Therefore, statistical models were adjusted for age, sex, ethnicity, smoking status, mean systolic and diastolic blood pressure, total cholesterol, and number of diagnosed comorbid conditions, number of primary care visits in the year before the diagnosis of type 2 diabetes, and general practice IMD. Statistical models were further adjusted for the year of diagnosis of type 2 diabetes during the study period (2004–2017). National guidance in England published in 2012 set out a proactive approach to type 2 diabetes prevention through identification and improved clinical management of pre-diabetes.8 We used receiver operating characteristic (ROC) curves to assess whether the inclusion of a dummy variable defining whether diagnosis of type 2 diabetes occurred before or after 2012 would improve our models. Considering that ROC curve values did not differ from the models only adjusted for year of diagnosis, this latter model was preferred (data not shown). Adjusted ORs and 95% CIs were estimated and results were considered significant if p value <0.05. Statistical analyses were conducted using Stata SE V.15.1.
Results
In the 3 years before the diagnosis of type 2 diabetes, 65 787 individuals (41.2% of the study population) had at least one glycemic measure recorded and 43 885 individuals (66.7%) reached detection thresholds for pre-diabetes (table 1). Moreover, 74.4% of individuals detected with pre-diabetes had recorded at least one FPG measurement, 58.2% at least one HbA1c measurement, and 22.6% at least one OGTT measurement, while 53.0% had recorded a combination of these glycemic measures. During the 3-year period before the diagnosis of type 2 diabetes, the time interval from first glycemic measurement recorded to type 2 diabetes diagnosis was 33.0 months for individuals who reached detection thresholds for pre-diabetes and 33.1 months for those with normoglycemia. As compared with individuals with normoglycemia, individuals who reached detection threshold for pre-diabetes before diagnosis of type 2 diabetes had also higher HbA1c values at time of type 2 diabetes diagnosis (normoglycemia: 47.0 (19.1) mmol/mol; pre-diabetes: 50.4 (18.9) mmol/mol). Individuals with pre-diabetes were older and more likely to be men and smokers compared with individuals with prior normoglycemia and those without for glycemic measurement before the diagnosis of type 2 diabetes (table 1). They also had higher BMI and systolic blood pressure levels in the year following type 2 diabetes diagnosis compared with the other two groups. The number of individuals with pre-diabetes identified by the WHO/IEC criteria was lower than that for NICE and ADA diagnostic cut-points (27.4%, 32.2%, and 32.2%, respectively) with small differences in patient characteristics between groups (see online supplementary table S3–5).
Characteristics of the study population in the year following the diagnosis of type 2 diabetes stratified by whether individuals were tested and reached detection thresholds for pre-diabetes before the diagnosis of type 2 diabetes
Microvascular disease
Half of the study population (49.9%) had at least one microvascular or macrovascular disease at the time of type 2 diabetes diagnosis (figure 1). Over one-third (37.4%) had microvascular disease. Based on the WHO/IEC criteria, 30.7% of those with prior normal glycemic values, 42.4% of those with prior pre-diabetes, and 36.7% of those without glycemic measures recorded had either retinopathy or nephropathy. At the time of type 2 diabetes diagnosis, 13.9% of individuals with prior normal glycemic values, 25.2% of individuals with prior pre-diabetes, and 22.9% of individuals without glycemic measures recorded had retinopathy. When adjusting for confounders, those with pre-diabetes had 76% increased odds of having retinopathy at diagnosis (OR 1.76, 95% CI 1.69 to 1.85), while those without glycemic measures recorded had 50% increased odds (OR 1.50, 95% CI 1.44 to 1.57) compared with those with normal glycemic values.

Prevalence of microvascular (retinopathy and nephropathy) and macrovascular (acute coronary syndrome, cerebrovascular, and peripheral arterial disease) diseases present at time of the diagnosis of type 2 diabetes according to glycemic status in the 3 years before the diagnosis of type 2 diabetes. A microvascular disease was considered being present at time of type 2 diabetes diagnosis if the condition was diagnosed between 5 years before and 15 months after the diagnosis of type 2 diabetes. A macrovascular disease was considered being present at time of type 2 diabetes diagnosis if the condition was diagnosed any time before the diagnosis and during the year following the diagnosis of type 2 diabetes. For the detection of pre-diabetes, the WHO/International Expert Committee diagnostic criteria were adopted (FPG: 6.1–6.9 mmol/L, OGTT 7.8–11.1 mmol/L, HbA1c 42 to 47 mmol/mol or 6.0%–6.4%). FPG, fasting plasma glucose; OGTT, oral glucose tolerance test; T2D, type 2 diabetes.
The prevalence of diagnosed nephropathy present at time of diagnosis of type 2 diabetes was similar between those with normal glycemic values and those without glycemic values recorded (20.7% and 19.0%, respectively), while the prevalence was higher (23.8%) for those with pre-diabetes. After adjusting for confounders, those with pre-diabetes had 14% increased odds of having nephropathy at diagnosis (OR 1.14, 95% CI 1.10 to 1.19), compared with those with prior normal glycemic values.
The prevalence of both microvascular disease being present at time of diagnosis was 3.9%, 6.4%, and 5.2% in individuals with prior normal glycemic values, pre-diabetes, and those without glycemic measures recorded, respectively. Individuals who reached detection thresholds for pre-diabetes had 53% increased odds of having both diseases at time of diagnosis (OR 1.53, 95% CI 1.41 to 1.65), while those without glycemic measures recorded had 35% increased odds (OR 1.35, 95% CI 1.25 to 1.46), as compared with those with normal glycemic values (figure 2).
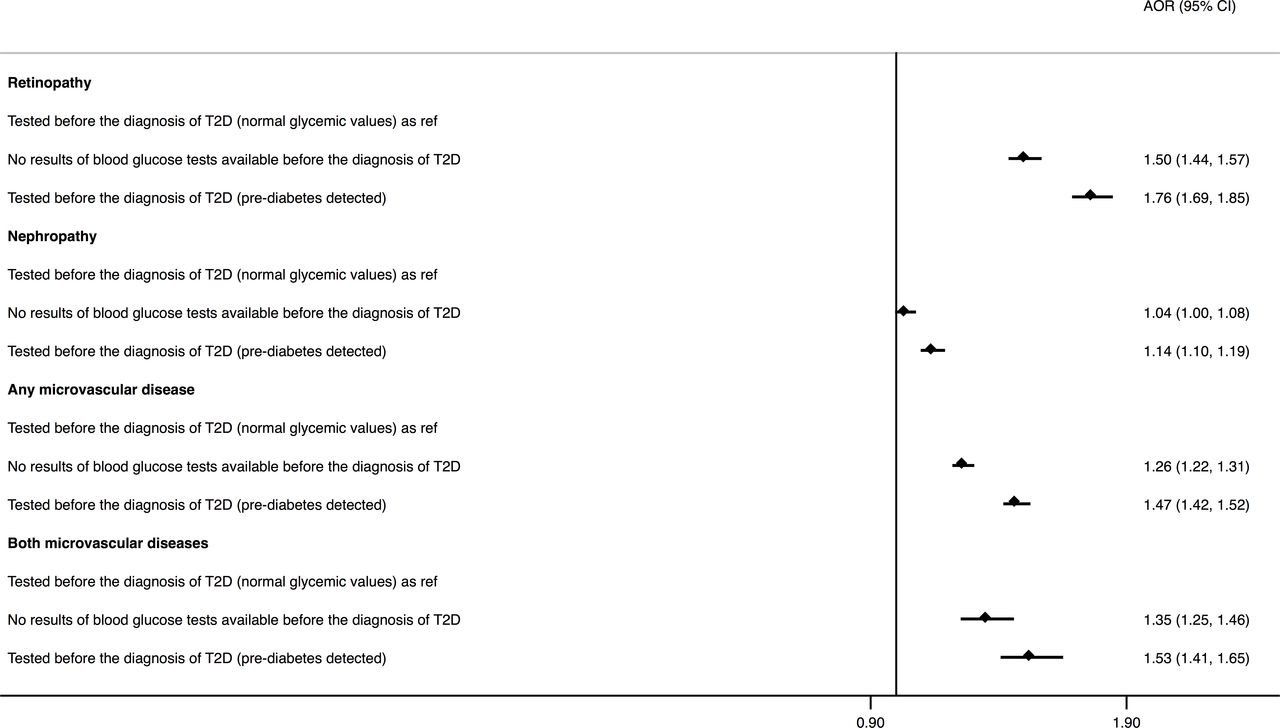
Association between glycemic testing and detection of pre-diabetes and presence of microvascular disease at the time of diagnosis of type 2 diabetes. Adjusted ORs and 95% CIs have been estimated employing multivariable logistic regression models adjusted for age, sex, ethnicity (white, South Asian, black, other, unknown), smoking status (non-smoker, ex-smoker, smoker), total cholesterol, systolic and diastolic blood pressure, number of coexisting chronic conditions, number of primary care visits in the previous year, general practice index of multiple deprivation, and year of diagnosis of type 2 diabetes. AOR, adjusted odds ratio; T2D, type 2 diabetes.
Macrovascular disease
At time of type 2 diabetes diagnosis, 23.5% of the study population had at least one diagnosed macrovascular disease. Using the WHO/IEC criteria, 26.9% of individuals with normal glycemic values, 29.8% of those with prior pre-diabetes, and 19.7% of those without glycemic measures recorded had a macrovascular disease. Individuals with glycemic measures within the normal range had the highest unadjusted prevalence of cerebrovascular disease (6.9%), while those who reached detection thresholds for pre-diabetes had the highest prevalence of acute coronary syndrome at time of diagnosis of type 2 diabetes (24.2%) (figure 1). When adjusting for confounders, individuals with prior pre-diabetes had 7% higher odds of previous diagnosis of acute coronary syndrome (OR 1.07, 95% CI 1.03 to 1.12), 12% lower odds of diagnosis of cerebrovascular events (OR 0.88, 95% CI 0.82 to 0.94), and peripheral arterial disease (OR 0.88, 95% CI 0.81 to 0.96), as compared with those with normal glycemic values recorded before the diagnosis of type 2 diabetes. Those without glycemic measures recorded had 27% lower odds of diagnosis of acute coronary syndrome (OR 0.73, 95% CI 0.70 to 0.77), 9% lower odds of diagnosis of cerebrovascular disease (OR 0.91, 95% CI 0.85 to 0.97), 10% lower odds of diagnosis of peripheral arterial disease (OR 0.90, 95% CI 0.84 to 0.98), and 23% lower odds of diagnosis of any macrovascular disease (OR 0.77, 95% CI 0.74 to 0.80; figure 3).

Association between glycemic testing and detection of pre-diabetes and presence of macrovascular disease at the time of diagnosis of type 2 diabetes. Adjusted ORs and 95% CIs have been estimated employing multivariable logistic regression models adjusted for age, sex, ethnicity (white, South Asian, black, other, unknown), smoking status (non-smoker, ex-smoker, smoker), total cholesterol, systolic and diastolic blood pressure, number of coexisting chronic conditions, number of primary care visits in the previous year, general practice index of multiple deprivation, and year of diagnosis of type 2 diabetes. AOR, adjusted odds ratio; T2D, type 2 diabetes.
Secondary analyses
Results obtained using NICE and ADA criteria for the detection of pre-diabetes were broadly similar to the findings for the WHO/IEC criteria (see online supplementary figure S6–9). However, when using the NICE and ADA criteria, –individuals without glycemic measures recorded had 12% and 9% increased odds of nephropathy present at time of the diagnosis of type 2 diabetes, respectively, as compared with those with prior normal glycemic values (see online supplementary figure S8). Furthermore, individuals who reached the detection thresholds for pre-diabetes had 8% increased odds of having any macrovascular disease at diagnosis, as compared with those with normal glycemic values (see online supplementary figure S9).
When further classifying individuals with prior pre-diabetes into two groups based on having or not having a diagnostic code recorded for pre-diabetes, the OR for having vascular diseases were lower among individuals with a pre-diabetes diagnostic code assigned for most study outcomes. For instance, compared with individuals with normal glycemic values recorded, individuals with a diagnostic code for pre-diabetes had 43% higher odds of any microvascular disease at the time of type 2 diabetes diagnosis, while those without diagnostic codes had a 51% increased odds (diagnostic assigned: OR 1.43, 95% CI 1.37 to 1.49; without diagnostic code: OR 1.51, 95% CI 1.45 to 1.57). Full results are shown in online supplementary figures 10 and 11.
Discussion
In this large retrospective study of a cohort of individuals newly diagnosed with type 2 diabetes in England, we found that the presence of microvascular and macrovascular disease varied substantially by glycemic status before diagnosis. Compared with individuals with glycemic levels within the normal range within 3 years before type 2 diabetes diagnosis, individuals with prior pre-diabetes and those without glycemic testing were significantly more likely to have microvascular disease at the time of type 2 diabetes diagnosis. Individuals with prior pre-diabetes were also more likely to have a previous diagnosis of acute coronary syndrome at the time of diagnosis. Conversely, individuals with prior pre-diabetes were less likely to have cerebrovascular and peripheral arterial disease compared with those who had glycemic values within the normal range before type 2 diabetes diagnosis. There were only small variations in these findings across various pre-diabetes diagnostic criteria including WHO/IEC, ADA, and NICE. Individuals who had a diagnostic label for pre-diabetes in their health records had lower odds of microvascular and macrovascular diseases compared with those with pre-diabetes without a diagnostic code.
In this study, we specifically focused on individuals who eventually progressed to type 2 diabetes to examine how prior glycemic testing and status is linked to vascular disease in a population which would benefit the most from preventative interventions. Over one-third of individuals in this study were diagnosed with either retinopathy or nephropathy at the time of type 2 diabetes diagnosis, one-fifth had at least one macrovascular disease, and half of them had at least one microvascular or macrovascular disease. These findings correspond with previous studies reporting a high burden of vascular disease among newly diagnosed individuals with type 2 diabetes,39–41 and support existing evidence suggesting that in individuals with pre-diabetes vascular disease might occur even before progressing to type 2 diabetes.18 19 Pre-diabetes is associated with an excess risk for the development of both macrovascular and microvascular diseases with a continuum of risk across the glycemic range of pre-diabetes.6 16 42 In the majority of people who progress to type 2 diabetes, an abrupt increase in glycemic measures has been described within 2 to 3 years before diagnosis.6 30 In our study, the higher burden of retinopathy among individuals with pre-diabetes compared with individuals with normoglycemia might be explained by prolonged exposure to mild hyperglycaemia.
Accordingly, individuals with glycemic values within the normal range might include a subgroup of individuals with a more rapid progression to type 2 diabetes or could represent people with a similar glycemic trajectory leading to diabetes but with a diagnosis earlier in the natural history of the disease or most likely a combination of these mechanisms.6 43 It is also important to note that while more than 80% of this group had recorded measures of FPG in the 3 years before the diagnosis of type 2 diabetes, only less than a quarter (23.7%) had recorded measures of more than one type of glycemic test, which might suggest that this group was less frequently and accurately tested. Considering the predominant use of FPG, more prone to intra-person variability as compared with HbA1c, and the intermittent nature of glycemic values during the pre-diabetes status and in general in the 3 years before progression to type 2 diabetes,43 44 a proportion of this group might have been misclassified with glycemic values within the normal range but this reflects detection patterns in real-world settings.
Importantly, 59% of individuals did not have a recorded glycemic measurement in the 3 years before type 2 diabetes diagnosis. Individuals without glycemic measurements had a notably higher mean HbA1c following type 2 diabetes diagnosis compared with those with glycemic testing (with or without pre-diabetes), potentially indicating late diagnosis of type 2 diabetes and leading to delayed treatment. The clinical characteristics of these people are compatible with at least two explanations: First, these people may be less health conscious and have a worse adherence with preventive procedures reflected by their higher prevalence of smoking and a lower number of primary care visits. Second, individuals without previous glycemic testing before their diagnosis of type 2 diabetes might have had lower vascular risk, as reflected by lower unadjusted prevalence of macrovascular disease at time of diabetes diagnosis, and lower number of other comorbid conditions. This may have resulted in fewer contacts with primary care and missed opportunities for screening. The considerably higher mean HbA1c at the time of diagnosis in this group may reflect a diagnosis at a later stage compared with the other groups and explain the higher prevalence of retinopathy. This is also in line with previous findings showing that glycemic testing and clinical management might potentially delay the diagnosis of diabetes and potentially its complications.45
The differences for nephropathy were less pronounced between the glycemic groups compared with that for retinopathy. These findings suggest that the association between pre-existing pre-diabetes and nephropathy might not be as strong as that for retinopathy. This is in line with the findings of a recent meta-analysis that concluded that the association between pre-diabetes and nephropathy was significant but modest, and this might be partially explained by underlying confounding or common causes contributing to both hyperglycemia and kidney disease.6 46 A small proportion of individuals (5.4% considering the whole sample) had both retinopathy and nephropathy in this study, potentially indicating prolonged exposure to chronic hyperglycemia or non-diabetic glomerular disease in some individuals that, at least partly, may explain the different patterns of renal involvement.47 48
We only found small variations in our findings across pre-diabetes subgroups defined by WHO/IEC, NICE, and ADA, suggesting that when focusing on the proportion of the pre-diabetes population who eventually progresses to type 2 diabetes, differences are less pronounced then what has been found in studies focusing on the whole pre-diabetes population, including those who will never progress to type 2 diabetes.12
We found that individuals with pre-diabetes detected before the diagnosis of type 2 diabetes were more likely to have a previous diagnosis of acute coronary syndrome but were less likely to have cerebrovascular and peripheral arterial disease at time of type 2 diabetes diagnosis. These findings correspond with previous studies showing that chronic hyperglycemia contributes to the pathogenesis of macrovascular dysfunction.6 14 16 17 Hyperglycemia has been shown to be strongly associated with an increased risk of acute coronary syndrome.6 49 Individuals with acute coronary syndrome have increased prevalence of pre-diabetes and the risk of mortality for those hospitalized with acute coronary syndrome with hyperglycemia is also higher.6 49 However, the association between pre-diabetes and cerebrovascular disease is less clear. For instance a meta-analysis found that the associated risk of cerebrovascular disease among those having pre-diabetes is modest.50 These findings are also compatible with a potential surveillance bias: people with any cardiovascular disease are more likely to be screened for type 2 diabetes and intermediate hyperglycemia compared with the general population, potentially resulting in an earlier diagnosis of type 2 diabetes. This bias might have had a greater influence on findings where the link between pre-diabetes and the outcome is weaker and may have changed the direction of the association (ie, cerebrovascular disease as compared with acute coronary syndrome).
Strengths and limitations
To our knowledge, this is the first large population-based study to examine associations between glycemic status before type 2 diabetes diagnosis and the presence of microvascular and macrovascular disease in individuals newly diagnosed with type 2 diabetes. Our findings provide further evidence that pre-diabetes has significant clinical implications for microvascular and macrovascular diseases and type 2 diabetes outcomes. We used routinely collected primary and secondary care data representative of the English population to better understand these associations in real-world settings. While the implementation of a national retinopathy screening program in the UK and the increased surveillance within the QOF ensured good quality data for the diagnosis of retinopathy and nephropathy, we did not include diabetic neuropathy in our analyses because the diagnosis and coding of this condition appears suboptimal in primary care settings in England.51 We could not assess the duration individuals remained in the pre-diabetes state before progressing to type 2 diabetes, and the focus of the study was to identify the recording of pre-diabetes before type 2 diabetes diagnosis. Additional study limitations include the presence of missing data for clinical variables such as blood pressure, BMI, total cholesterol, and HbA1c. However, we overcame the latter issue by using multiple imputation by chained equations. It was not possible to assess differences in adherence to lifestyle interventions, as we did not have data on diet and physical activity. Finally, when using routinely collected data, concerns have been raised about miscoding, misclassification, and misdiagnosis. However, CPRD is subject to regular quality checks and is widely used for health research.25
Implications for clinical practice
Microvascular and macrovascular diseases were present in 37%–24% of people with newly diagnosed type 2 diabetes, with over half not having any glycemic measurement within 3 years before their diagnosis. While there are many unanswered questions regarding its detection, pre-diabetes has significant clinical implications for microvascular and macrovascular diseases and type 2 diabetes outcomes. A major consideration is whether targeted preventive strategies that identify individuals with pre-diabetes for interventions would provide opportunities for vascular risk reduction,21 42 52 considering that major benefits are likely to occur from early diagnosis and treatment.45 While discussions on the pathophysiological differences between pre-diabetes subtypes continue, there have been calls to move away from a glucocentric definition toward a multifactorial detection strategy for pre-diabetes that reflects the presence of other risk factors for type 2 diabetes as well as early manifestation of vascular disease.6 53
Conclusion
Our large observational study using real-world data has shown that both microvascular and macrovascular diseases were frequently detected at the time of type 2 diabetes diagnosis. Microvascular disease was more frequent among individuals with newly diagnosed type 2 diabetes who were previously detected with pre-diabetes. The identification of pre-diabetes and specific clustering of pre-diabetes with other risk factors for type 2 diabetes might prompt earlier assessment for risk factors and tailored cardiovascular risk reduction strategies during the pre-diabetes phase to reduce the burden of vascular disease, but further research is needed to confirm this.
Acknowledgments
Imperial College London is grateful for support from the NW London NIHR Applied Research Collaboration. KK acknowledges support from NIHR Applied Research Collaboration East Midlands. JV is National Clinical Director for Diabetes and Obesity at NHS England and NHS Improvement, and is Clinical Lead for the English National Health Service Diabetes Prevention Programme.
References
Footnotes
Contributors EPV, CM, and RP conceived and designed the study. RP analyzed the data. All authors discussed the data analyses and interpreted the results. EPV, CM and RP wrote the first draft of the manuscript. All authors critically revised the manuscript, approved the final manuscript for publication, and agreed to act as guarantors of the work. RP has full access to all data used in the study and takes responsibility for the integrity of the data and the accuracy of the data analysis.
Funding The authors have not declared a specific grant for this research from any funding agency in the public, commercial or not-for-profit sectors.
Disclaimer The views expressed in this publication are those of the authors and not necessarily those of the NHS, the NIHR, or the Department of Health and Social Care.
Competing interests None declared.
Patient consent for publication Not required.
Ethics approval This study was approved by the Independent Scientific Advisory Committee (ISAC) of the CPRD (protocol no. 18_208R), before data analysis was conducted. Ethical approval is not needed for database studies and ISAC provide the necessary regulatory approvals. Each practice in CPRD has consented to be included; patients within each consented practice are automatically included.
Provenance and peer review Not commissioned; externally peer reviewed.
Data availability statement Data may be obtained from a third party and are not publicly available. The data that support the findings of this study are available from CPRD, but restrictions apply to the availability of these data, which were used under license from the UK Medicines and Healthcare products Regulatory Agency for the current study, and so are not publicly available.