Article Text

Abstract
Introduction Maintaining glycemic control during and after physical activity (PA) is a major challenge in type 1 diabetes (T1D). This study compared the glycemic variability and exercise-related diabetic management strategies of adults with T1D achieving higher and lower PA loads in nighttime–daytime and active– sedentary behavior hours in free-living conditions.
Research design and methods Active adults (n=28) with T1D (ages: 35±10 years; diabetes duration: 21±11 years; body mass index: 24.8±3.4 kg/m2; glycated hemoglobin A1c: 6.9±0.6%) on continuous subcutaneous insulin delivery system with predictive low glucose suspend system and glucose monitoring, performed different types, duration and intensity of PA under free-living conditions, tracked by accelerometer over 14 days. Participants were equally divided into lower load (LL) and higher load (HL) by median of daily counts per minute (61122). Glycemic variability was studied monitoring predefined time in glycemic ranges (time in range (TIR), time above range (TAR) and time below range (TBR)), coefficient of variation (CV) and mean amplitude of glycemic excursions (MAGE). Parameters were studied in defined hours timeframes (nighttime–daytime and active–sedentary behavior). Self-reported diabetes management strategies were analysed during and post-PA.
Results Higher glycemic variability (CV) was observed in sedentary hours compared with active hours in the LL group (p≤0.05). HL group showed an increment in glycemic variability (MAGE) during nighttime versus daytime (p≤0.05). There were no differences in TIR and TAR across all timeframes between HL and LL groups. The HL group had significantly more TBR during night hours than the LL group (p≤0.05). Both groups showed TBR above recommended values. All participants used fewer post-PA management strategies than during PA (p≤0.05).
Conclusion Active people with T1D are able to maintain glycemic variability, TIR and TAR within recommended values regardless of PA loads. However, the high prevalence of TBR and the less use of post-PA management strategies highlights the potential need to increase awareness on actions to avoid glycemic excursions and hypoglycemia after exercise completion.
- exercise
- diabetes mellitus, type 1
- hyperglycemia
- hypoglycemia
Data availability statement
Data are available on reasonable request. Raw data sets.
This is an open access article distributed in accordance with the Creative Commons Attribution Non Commercial (CC BY-NC 4.0) license, which permits others to distribute, remix, adapt, build upon this work non-commercially, and license their derivative works on different terms, provided the original work is properly cited, appropriate credit is given, any changes made indicated, and the use is non-commercial. See: http://creativecommons.org/licenses/by-nc/4.0/.
Statistics from Altmetric.com
WHAT IS ALREADY KNOWN ON THIS TOPIC
Physical activity promotes glycemic control reducing glycemic fluctuations and the time spent in these fluctuations (glycemic variability); however, hypoglycemia is still a barrier to performing exercise in people living with type 1 diabetes (T1D).
There is scarce information on how different intensities of physical activity (PA) impact glycemic variability in people with T1D that perform exercise in free-living conditions, along with the diabetes management strategies used during and after exercise.
WHAT THIS STUDY ADDS
People with T1D who accomplish higher physical activity in free-living conditions present hypoglycemic time above recommended values and show a higher glycemic variability after they execute exercise.
Fewer diabetes strategies are taken after exercise than during PA.
HOW THIS STUDY MIGHT AFFECT RESEARCH, PRACTICE OR POLICY
These findings highlight the need to increase awareness on active people living with T1D about physical exercise strategies after executing activity to avoid glycemic excursions and hypoglycemia.
Introduction
People living with type 1 diabetes (T1D) who perform physical activity (PA) experience problems maintaining glycemic control. PA alters people with T1D’s glycemic levels due to the impact on the consumption of glucose that varies depending on the activity intensity. On the one hand, high-intensity activities can cause a greater and lasting elevation in blood glucose levels (hyperglycemia). Alternatively, long periods of lower intensities of PA generally result in decreased glycemia levels associated with higher peripheral insulin sensitivity and increased risk of hypoglycemia.1 Since variations in daily PA are part of everyday life for people living with T1D, which represents a demanding condition for this group,2 understanding the relationship between these variations in blood glucose control is important. Consequently, analysing and enacting T1D treatment strategies can improve glycemic control.3
Glycated hemoglobin A1c (HbA1c) is commonly used to measure glycemic control4 and is inversely correlated with minutes of PA.5 In fact, people living with T1D who are not physically active have higher HbA1c values when compared with their counterparts.6 However, as HbA1c represents the average glycemic levels over the last 3 months, glycemic control is not entirely expressed by this marker,1 since it does not consider daily fluctuations.2 7
To improve glycemic control, the last decade has witnessed technological advances with continuous glucose monitors (CGM) combined with continuous subcutaneous insulin infusion (CSII). Some pumps have a system called predictive low-glucose suspend system (PLGS), allowing automatic suspension of basal insulin when sensor glucose value is predicted to reach or fall below a present low limit within 30 min. CGM allows for new markers to measure glucose fluctuations, such as time in different glucose ranges, coefficient of variation (CV) and mean amplitude of glycemic excursion (MAGE) among other indices.8 These key parameters permit the assessment of glycemic variability,9 which is a sensitive measure of glycemic health that considers both the amplitude of the excursion and the time spent in the excursion.10–12
First, time in different glucose ranges are useful variables to evaluate hypoglycemia and hyperglycemia occurrence, respectively, alerting the risk of extreme glycemia values in athletes with diabetes.2 Time in glucose ranges include time in range (TIR) accounts for glucose target range between 3.9 mmol/L and 10.0 mmol/L; time below range (TBR), when glucose is below 3.9 mmol/L; time very below range (TBR2), when glucose is below 3.0 mmol/L; time above range (TAR), when glucose is above 10.0 mmol/L; and time very above range (TAR2), when glucose is above 13.9 mmol/L.13 Second, CV is the strongest predictor of glucose levels hitting the threshold of 3.0 mmol/L in 100 people with T1D.14 Finally, MAGE is an arithmetic average of either the upward or downward of all glycemic excursions exceeding the threshold, which is the SD of blood glucose obtained from all blood glucose concentrations within a time period.15 Furthermore, MAGE positively correlates with oxidative stress16 and an increased risk of distal symmetrical polyneuropathy, conditions that are also associated with nocturnal hypoglycemia.17
Various studies have related glycemic variability with diabetes complications, such as microvascular alterations and risk of hypoglycemia, more than glucose mean; however, this association is still controversial.12 18 The risk of hypoglycemia is reported to be the most significant barrier for people with T1D to practice sports.19 Glycemic variability can be reduced by PA,2 20 21 if factors such as PA type, intensity, duration, pre-exercise glucose levels and cardiovascular fitness are taken into consideration. Considering the positive effects PA has on glycemic variability, as well as on other health aspects for people living with T1D, the American Diabetes Association recommends at least 150 min of moderate-to-vigorous intensity activity on a weekly basis.3 However, most individuals with T1D do not meet this recommendation,13 and only some of them perform exercise at training and competition levels.2 Glycemic variability is important to predict hypoglycemia14; however, evidence on how PA intensity relates to glycemic variability is scarce and inaccurate because most studies collect subjective PA data, such as self-reported questionnaires.4 22 23
Research results show PA can precipitate greater glycemic variability and hypoglycemia episodes,24 which has been suggested to cause more serious damage to the body than high levels of stable blood glucose.25 Contradictorily, decreasing sedentary time positively impacts glycemic variability, independent of increases in PA.13 15 24 In addition, controlled PA, or combined with personal exercise, has shown that PA decreased mean glycemia, TBR, MAGE and CV, increasing TIR.26–28 However, knowledge is lacking about glycemic variability parameters reflecting glycemic excursions in T1D people accomplishing different PA intensities in non-laboratory conditions.
In conjunction with glycemic variability parameters, people living with T1D also benefit from complementary diabetes management exercise strategies (DMES) before, during or after exercise,29 depending on the person’s glycemic levels and the PA intensity. These strategies may include carbohydrate intake, insulin bolus modifications and temporary basal rates.29 These could be used to avoid glucose excursions, reducing glycemic variability. However, the DMES that are used in different PA intensities by T1D people remains unclear.
Study aim
To compare glycemic variability through CGM in people living with T1D with lower and higher PA intensity loads in nighttime–daytime and active–sedentary behavior hours in daily life conditions during 14 days of follow-up. The secondary aim is to contrast DMES use in people with T1D undertaking high or low daily activity.
Materials and methods
Study design
This is an observational study with a 14-day follow-up of people living with T1D grouped according to PA time and intensity configured in loads. Our preliminary pilot study data considered Medtronic 640G and consecutive accelerometer records for 14 days in one patient, indicating that the PA level is inversely related to TIR (r=−0.47; p≤0.05). Therefore, to obtain a similar correlation coefficient, considering α=5% and ß=20%, we required a 33-participant sample size. We categorized participants as lower load (LL group; n=14) and higher load (HL group; n=14) if they were under or above the median of daily counts during the study (median=61 122, SD=31 109). For a participant’s data to be included, a minimum of 14 valid days were required, considering valid those days with time over a threshold of 300 min using the accelerometer (5 hours) and 1150 min using the CGM (19 hours).
Participant recruitment
All participants were enrolled from July 2020 to July 2021, according to the following inclusion criteria: adults age range 18–65 years; reported T1D diabetes diagnosis; duration of diabetes over 1 year; HbA1c less than 10%; CSII with PLGS function Medtronic Minimed 640G and Guardian 3 Glucose Sensor (Medtronic, Northridge, California, USA) use over 1 year; and any type of self-reported PA over 90 min per week that defines a person as active according to the National Sport Survey of Chile.30 Exclusion criteria included pregnancy, last HbA1c over 9.9%, cardiovascular conditions making exercise unsafe (cardiomyopathy, atherosclerosis and high blood pressure), COVID-19 diagnosis or other infection that could alter glycemic control. The people who participated in this study belong to the national government program for insulin pump reimbursement. Beneficiaries need to approve a 20 hours training program to obtain the PLGS, monthly sensors and supplies free of charge and require quarterly appointments with physicians, dieticians and nurses. If monthly appointments or sensor use (80% of the time) are not met, supplies are discontinued.
Instruments and data collection
A total of 154 persons, enrolled by social media, replied to the recruitment questionnaire, which included sociodemographic and anthropometric measurements (age, gender, body mass index (BMI), years with diabetes, last HbA1c levels, years of exercise training, CSII use, the basal insulin dose used per kilogram of body weight (BI/BW) and DMES including an open question. Given the pandemic confinement, the first subject visit had an online format. Participants joined an online meeting where the research team described the study and confirmed informed consent comprehension. Fifty-six patients attended the interview and were invited to participate in a second online survey on diabetes management strategies for PA. Selected persons answered the International Physical Activity Questionnaire29 short form to confirm eligibility. Participants were instructed to use their CSII, CGM and PLGS in the same way they do daily, where a video demonstration of the accelerometer and sports watch usage was presented. Twenty-eight participants completed eligibility criteria including the interview, the survey and data download for PA and glycemic variability monitoring evaluation.
PA and glucose levels were followed for 14 days using an accelerometer and CSII with PLGS. Participants used rapid-acting insulin (n=21: Novorapid️ (Novo Nordisk, Bagsværd, Denmark); n=5 lispro_humalog: (Lilly, Eli Lilly and Company, Indianapolis, USA); n=4 glulisina_apidra️_Solostar:️ (Sanofi-Aventis Laboratory)). All participants signed written informed consent.
Diabetes management strategies for exercise
DMES were adapted from Zaharieva et al,29 complementing the recruitment questionnaire results. The proposed strategies were submitted to a review committee composed of three clinical experts with more than 10 years of experience with sports and T1D. Each participant had to report in a survey the number of strategies they executed from a suggested list of 10 during the measurement period (online supplemental table 1). The strategies were grouped according to those taken during PA, considering 90 min before PA onset and during PA, and post-PA strategies, executed right after PA and the following 24 hours. Finally, the number of strategies was counted and analysed as a score.
Supplemental material
Glucose variability
CGM data allowed the collection of interstitial blood glucose, with records once every 5 min (0.003 Hz) to calculate mean glucose. Following Battelino et al,13 TIR, TAR, TBR were computed as the average time a given subject spent in the corresponding interstitial glucose range. TBR2 was also analysed separately, and TAR2 was not considered in the analyses due to the low data acquisition (~0.1%). CV% was computed with CGM measurements as the interstitial blood glucose SD divided by its mean times 100 for each subject per measurement time. MAGE was also calculated as an arithmetic average of either the upward or downward of all glycemic excursions exceeding the threshold, defined as the SD of blood glucose obtained from all blood interstitial glucose concentrations within a time period per subject.15
PA measurement
Enrolled participants used an Actigraph (Actigraph wGT3X+, USA, 2004) triaxial accelerometer on their hips while awake for 14 days to measure PA intensity. Triaxial acceleration magnitudes were recorded at a 30 Hz frequency. Following Freedson et al,31 counts were defined as vertical acceleration magnitudes greater than 0. Data were downloaded using Actilife software (V.6.13.4, Actigraph LLC) and summarized for every minute during the study period, obtaining counts per minute for waking hours defined as daytime hours. Nighttime hours considered the time, while the accelerometer reported no activation function. PA was classified using counts per minute thresholds as very vigorous (over 9498), vigorous (over 5724 and below very vigorous), moderate (over 1952 and below vigorous), light activity (over 650 and below moderate) or sedentary behavior (below 650).31 Active hours (AH) were defined as any moment when counts per minute were equal or above the light activity threshold and sedentary behavior hours (SBH) accounted for the rest. Additionally, counts per minute were added each day, obtaining counts per day, and subsequently, daily counts mean was estimated averaging count per day during the measurement time. Accelerometer and CSII data were paired to homologate the time units. Since CGM data have the lowest frequency of both datasets, the accelerometer measurements were aggregated at 5 min intervals. For this aggregation, average counts per minute were computed throughout each 5 min timeframe. After time unit homologation, both datasets were merged, obtaining accelerometer and CGM measures for each 5 min interval. Consequently, CGM data corresponded to interstitial glucose measures, while the accelerometer inclination sensor informed usage.
Sports watches (Garmin Forerunner 745, USA, 1989) were used 24 hours per day to account for PA types. Participants were asked to declare their preferred PA types, which were programmed in the watches to facilitate the search and registration process, although watches were not used to measure any intensity of the activity performed.
Statistical analysis
Shapiro-Wilk test was used to test the normality of the variable distribution. Depending on the Gaussian distribution of data, Mann Whitney/Wilcoxon rank-sum test or t-test was performed to study differences in the means of the sociodemographic and clinical variables between HL and LL groups. Glycemia was analysed by the time defined as AH and SBH, comparing each glycemic variability variable within groups, and Mann Whitney/Wilcoxon rank-sum test performed to evaluate differences. Correlation analyses between BMI and glycemic variability parameters were performed using Pearson correlation. Correlation of DMES score with sports years was analysed using Spearman correlation. Correlation significance was analysed using two-sided t-test. P values and Cohen effect were reported for each comparison, and p value ≤0.05 (two tailed) was considered statistically significant. Data processing and statistical analyses were conducted using custom software developed in R statistical computing language V.4.1.2 (R Core Team, Vienna, Austria, 2022). Statistically significant results were revised with a post hoc analysis to evaluate statistical power (≥80%) with G-Power software.
Results
Characterization of PA, sociodemographic and clinical variables according to PA groups
Data were collected from 28 of the 33 enrolled participants. We excluded five participants, two did not follow the CSII with PLGS inclusion criteria and three participants had incomplete data. All participants in this study were aged 35±10 years old, had been living with T1D for 21±11 years, with reported HbA1c of 6.9%±0.6 and had an average of 11±10 years practicing PA. They were using a CSII with PLGS Medtronic 640G pump and Guardian 3 Sensor for 4±3 years. Total PA minutes per week (mean±SD) accounted for light PA: 543.0±307.5, moderate PA: 204.7±127.6, vigorous PA: 57.9±85.4 and very vigorous PA: 7.8±10.7 (table 1). Both groups were similar in all reported demographic information (age, educational level, diabetes duration, HbA1c levels, BMI, CSII years of use and basal insulin/body weight) (table 1) and also in glycemic variability markers (table 2). Percentage of time participants used the Guardian Sensor was 91.8%±4.7% in the HL group and 91.9%±4.9% in the LL group.
Descriptive statistics, sociodemographic, anthropometric and diabetes characteristics by group
Glycemic variability in individuals by groups, during daytime and nighttime hours of the 14-day measurement period
When we compared the PA intensity between groups, HL group accomplished more minutes in light, moderate and vigorous PA intensities than LL (PA intensity fold change: light physical activity=2; moderate physical activity=2; vigorous physical activity=9.8, p≤0.01), and no statistical difference was found between groups in minutes in very vigorous PA (p=0.08) (table 1). All participants met the recommended PA for people living with T1D.12 The type of exercises most reported were strength training, followed by biking, running and walking. HL group most reported exercise types were walking, strength training and running, while for the LL group were biking, strength training and running. Percentage of exercise types recorded by smartwatch per group is summarized in online supplemental table 2.
Glycemic variability and its relationship with sociodemographic, clinical and management strategies variables
All participants showed mean glucose 7.7 mmol/L±1.0, CV 30%±3, MAGE 3.7 mmol/L±0.6, TIR 75%±1 and TAR 19%±11 within normal ranges31 32 except for TBR 6%±4 during daytime hours. During nighttime hours similar glycemic variability parameters were observed (mean glucose 7.4 mmol/L±0.9; CV 26%±4; MAGE 3.1 mmol/L±0.7; TIR 79%±10; TAR 16%±1), except for TBR that was over the recommended values (6%±4) (table 2). Glycemic variability parameters were similar between groups in daytime hours (mean glucose LL 7.9 mmol/L±1; HL 7.5±1.1, CV LL 29%±3; HL 31%±2, MAGE LL 3.6 mmol/L±1; HL 3.7 mmol/L±1, TIR LL 75%±12; HL 76%±8, TAR LL 21%±12; HL 18%±8, and TBR LL 5%±2; HL 7%±4, p>0.05) (table 2). During daytime, a small cohen effect was found in the absolute mean difference between groups in TAR (0.28), and a medium cohen effect was observed in mean glucose, CV and TBR (0.4, 0.5 and 0.61, respectively) (table 2). Both groups presented TBR above clinical recommended values31 during the measurement period in AH, SBH and nighttime (figure 1A–C). TBR2 was 1.0%±1.0 in participants considering all measured hours, with no significant difference between groups (LL 0.7%±0.4; HL 1.3%±1.2). During nighttime hours, TBR was higher in HL versus LL group (LL 4%±3; HL 7%±5; p≤0.05) (table 2), but no differences were observed in TBR2 (LL 1%±1.4; HL 1.5%±1.3).

TAR, TIR and TBR during active, sedentary behavior and night hours by groups. Time spent in different glycemic ranges are divided by: TIR(%) glucose between 3.9 mmol/L and 10.0 mmol/L in green; TBR(%) glucose <3.9 mmol/L in red; TAR(%) glucose >10.0 mmol/L in yellow. (A) TAR, TIR and TBR for lower load group and higher load group during active hours, (B) during sedentary behavior hours and (C) during night hours. TAR, time above range; TBR, time below range; TIR, time in range
In the LL group, we found a negative correlation between TIR and BMI (r=−0.54; p≤0.05) and a positive correlation between TAR and BMI (r=0.53; p≤0.05) (online supplemental figure 1A,B). TBR was not correlated with BMI in this group (online supplemental figure 1C). HL group showed no correlation between TIR, TAR and TBR with BMI (online supplemental figure 1A-C). In addition, only participants in the LL group presented a direct correlation between glycemia mean and BMI (r=0.52; p≤0.05) (online supplemental figure 1D). Furthermore, CV was positively correlated with BMI in the LL group (r=0.56; p≤0.05) (online supplemental figure 1E). Correlations between BMI and TBR (slope 0.01), and mean glucose (slope 0.05) were significantly different between groups (p≤0.05) (online supplemental figure 1B–D).
DMES were used by all participants, preferably during PA (72% of reported strategies). The three most used strategies were basal insulin reduction previous to PA, basal insulin reduction during PA and snack previous to PA (online supplemental tables 1 and 3). The least used strategy was bolus reduction for food after PA execution (online supplemental table 3). Taken as DMES score, informed strategies during PA hours versus post-PA were significantly different in the total of participants (p≤0.05) (online supplemental figure 2A), but non-differences were detected between groups (table 1). In addition, sports years were directly correlated with total strategies score in all participants (r=0.37, p=0.05) (online supplemental figure 2B), and non-correlation was found when data were segregated according to PA loads (LL r=0.4, p=0.09; HL r=0.18, p=0.5) (online supplemental figure 2C).
Glucose variability comparing daytime and nighttime hours
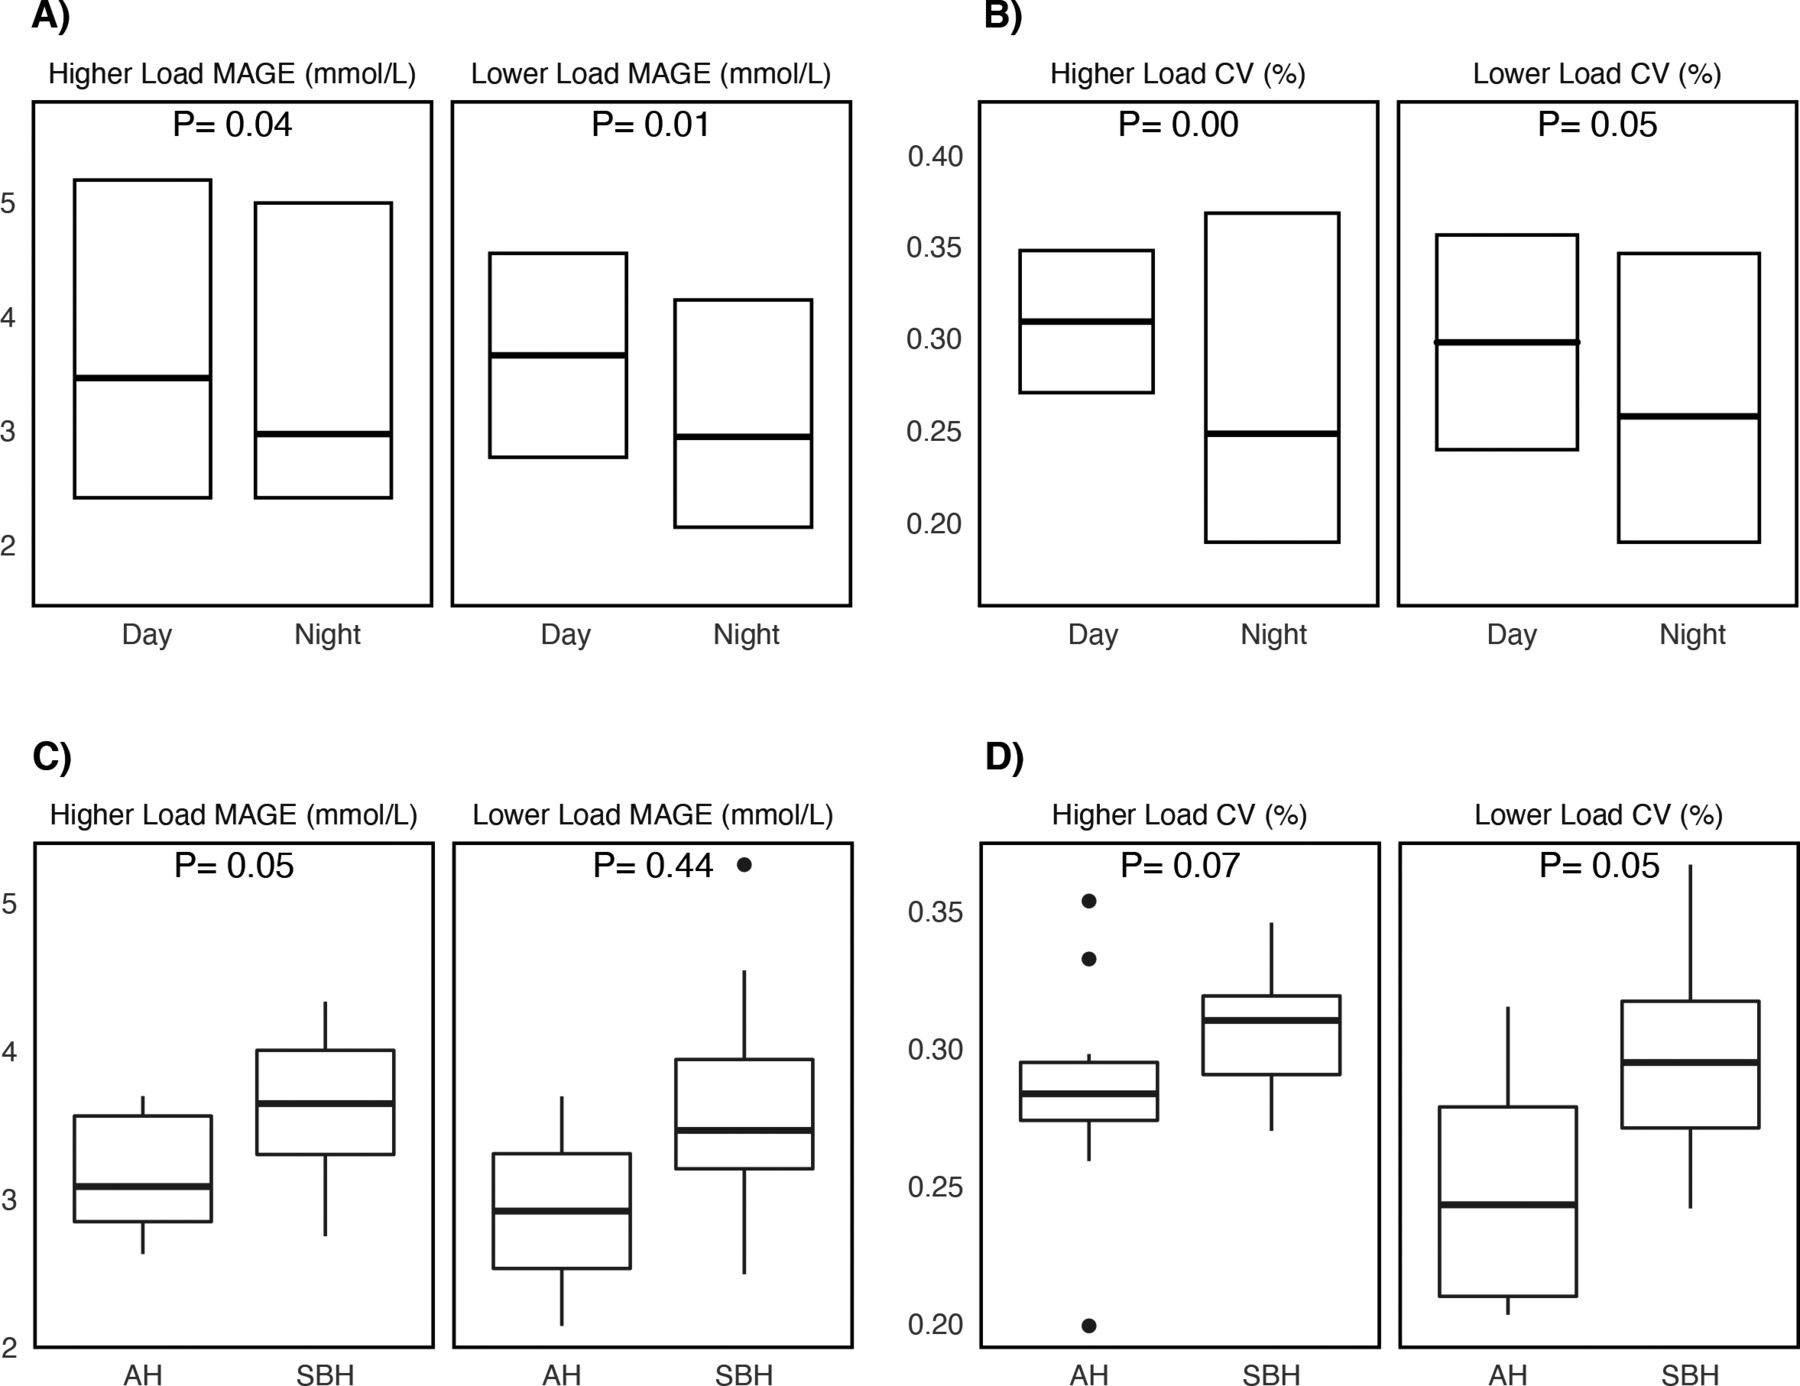
Glycemic variability markers during daytime and nighttime hours were different within groups for both PA loads in CV (LL p≤0.05; HL p≤0.05) and MAGE (LL p≤0.05; HL p≤0.05) (figure 2A,B; table 3). Participants did not differ in mean glucose (LL p=0.27; HL p=0.91), TIR (LL p=0.19; HL p=0.67), TBR (LL p=0.25; HL p=0.91) and TAR (LL p=0.25; HL p=0.84). In contrast, significant differences were found within groups in CV (LL p≤0.05; HL p≤0.05) and MAGE (LL p≤0.05; HL p≤0.05) (table 3).

Differences in glycemic variability markers between higher load and lower load groups. (A) MAGE (mmol/L) during day and night hours. (B) CV (%) during day and night hours. (C) MAGE (mmol/L) during active and sedentary behavior hours. (D) CV (%) during active and sedentary behavior hours. Wilcoxon test, *p<0.05. CV, coefficient of variation; MAGE, mean amplitude of glycemic excursions.
Glycemic variability indices, time in glucose ranges and diabetes strategies management in individuals during daytime–nighttime hours and active–sedentary behavior hours
Glucose variability comparing active and sedentary behavior hours
HL group exhibits no differences in glycemic variability markers of mean glucose, CV, TIR, TAR and TBR between AH and SBH, confirming that these participants are able to maintain the same ranges for those variables independently if they are executing PA (table 3). The opposite is observed for MAGE in this group (AH 3.2 mmol/L±0.6 vs SBH 3.6 mmol/L±0.5, p≤0.05) (figure 2C). CV in the LL group was higher during SBH (AH 25%±5 vs SBH 30%±3, p=0.05), with non-differences in the HL group (figure 2D), indicating that less physically active participants have increased glycemic variability in hours they are not performing PA compared with hours while they are. Other glycemic variability parameters (glycemia levels, MAGE, TAR, TBR and TIR) were similar between AH and SBH in the LL group (table 3).
Discussion
This study is the first to show glycemic variability does not differ during daytime between people living with T1D that accomplish the minimum recommended levels of PA in free-living conditions, in lower and higher PA loads. Participants maintained a glycemic range of 3.9–10.0 mmol/L for over 70% of the measurement time, meeting clinical standards for T1D population.13 Our results are probably related to a selection bias of participants with high baseline activity levels who are experienced in CSII with PLGS use and carbohydrate counting. However, all of them experienced a level of TBR above recommended levels during the day and night,13 despite using a PLGS system. In fact, the HL group had significantly increased TBR at nighttime. This could be explained by the findings that DMES usage post-PA use is much lower than during PA. Suggesting very active people with T1D require further support to implement post-PA DMES strategies as PLGS systems alone do not protect from nocturnal hypoglycemia.
The impact of PA on glycemic variability remains open to discussion. Our results are not aligned with Zhu et al, where PA is significantly associated with decreased glycemic variability in people living with T1D and T2D. This meta-analysis included only 32 physically active persons and showed PA treatment is associated with decreased MAGE and TAR, and increased TIR.32 In our study, the glycemic variability parameters, such as time spent in different glycemic ranges, were similar between the participant groups when analysed in daytime and nighttime. The same was observed with CV, both groups presented values below 36%, possibly because they were meeting the ATTD PA recommendation.13 Therefore, it is possible that meeting PA recommendations is enough to keep GV low and doing more PA does not provide additional benefit for GV. However, when comparing AH and SBH, differences started to show. Therefore, since we compared aggregated daily measures for each subject, it would be insightful to find other distributions of the glycemic variability parameters in participant groups (within specific PA events), enabling us to address interdependence between measurements.
Studies of PA levels in T1D typically use very small sample sizes of individuals, given the scarce amount of people living with T1D considered active. Most of them focus on comparing participants with non-diabetic individuals to evaluate the impact of disease on health variables.4 33 34 Nonetheless, since the environment and PA challenges for people living with T1D are quite different from healthy ones, it is necessary to reformulate the type and group of comparison. Therefore, according to PA load, we split our T1D group with all participants being active, looking to find glycemic variability differences and correlate them with healthcare parameters, such as BMI. Previously, young people living with T1D showed non-correlation between BMI and glycemic variability parameters (Hb1Ac, glycemic SD, MAGE).35 However, in a meta-analysis of people living with T1D and T2D, decreased MAGE during PA was associated with higher BMI, suggesting that it is more beneficial to be active in higher BMI context.32 In contrast, we found that participants in the LL group have a positive correlation between BMI with CV and TAR and negative between BMI and TIR. This result suggests that although people with T1D accomplish healthy PA levels, they can still be challenged to maintain glucose control, but fat mass impact over time in the glucose range needs to be measured specifically in active people with T1D. Nonetheless, this difference of BMI and glycemic variability correlations between studies could be related with the differential BMI composition (muscle and fat mass) in T1D people of our study. Further analysis including more specific fat mass measurement, avoiding muscle weight BMI bias, is necessary for accurate correlation with glycemic in active PA people.
CV showed interesting results from two perspectives that might express PA impact on glycemic control. First, differences were found in the LL group comparing SBH versus AH and not observed in the HL group. This could indicate that less active participants have lower CV stability than those more active. Nevertheless, it is important to highlight that both groups present the same CV during SBH; hence, the ability to maintain a CV might be determined by the intensity of PA. Previously, limited or non-differences for CV between PA intensities or exercise types (endurance-resistance) were found in postexercise hours in T1D under controlled conditions.36 Thus, glycemic variability data can differ between studies in controlled and free-living conditions and further our understanding about PA impact on glycemic control. Second, we found significant differences in CV and MAGE in both groups when comparing daytime with nighttime. This demonstrates that larger glycemic fluctuations are present in waking hours, whereas fewer excursions are observed during night hours, which is expected given the smaller number of actions taken by participants while sleeping.
Another important issue to note is that numerous factors influence glycemic variability. GV describes the between-day and within-day fluctuations inherent in T1D glucose management. This study did not consider other elements that may affect GV, such as errors in the estimation of carbohydrate count, insulin delivery pump settings metabolic and CGM reading error; however, the population studied has been highly trained in glucose management and insulin pump use. This can be inferred from the high time in the range prior to the study and the high percentage of sensor use.
High hypoglycemia imposes a physical challenge on people living with T1D during and after they exercise. However, both of our studied groups, who were experienced in PA and diabetes, presented TBR (>4%) and TBR2 (>4%) above recommended values.13 It would be interesting to understand why better knowledge of PA and T1D management is not associated to less PA-associated hypoglycemia.37 This could be due to diabetes management confidence that encourages higher tolerance for hypoglycemic risk.37 Also, in this regard, the HL group attenuated glycemic variability between AH and SBH was possibly observed because of insulin sensitivity than the LL group, which could have also led to a higher TBR overnight that the PLGS was not able to manage to recommended levels. According to Basu et al,38 this could be related to an increment of insulin sensitivity occurring in a trained muscle, associated with training-induced GLUT4 availability to the cell surface.
In order to help safely set higher PA goals, avoiding extreme glucose levels, management strategies should be incorporated and optimized.37 Our study shows active people living with T1D need different diabetes management according to their PA load to avoid hypoglycemia recurrency during nighttime in people with higher PA loads probably because insulin sensitivity remained for longer or maintained at a higher level, which meant it carried over to sedentary hours, whereas the LL group possibly did not perform enough PA to get the carryover effect on insulin sensitivity during SBH, hence higher glycemic variability throughout these hours. Consequently, strategies in LL group should aim for reducing glycemic fluctuations during SBH. For example, basal insulin reduction after exercise completion and during nighttime, a barely used strategy in our PA groups (18%), could be adjusted depending on PA intensity. Furthermore, a common management strategy for endurance PA, although not used by our participants, is bolus reduction before PA. This strategy is frequently used when people with T1D present hyperglycemia or a high carbohydrate intake before unplanned PA, which might require some insulin dose. However, larger meals are uncommon as people prefer to do PA without insulin on board. Furthermore, people in regular training require fewer carbohydrates prior to PA, with higher insulin sensitivity from increased glucose transport and metabolism.39
Our proposed division of DMES according to time of implementation (before or after exercise) could guide future recommendations for people living with T1D in relation to barriers to PA accomplishment.19 Our study shows that during PA strategies seem to be well used by active people with T1D; however, post-PA strategies are not sufficiently used, being necessary to focus on their incorporation and management, as even PLGS systems do not protect, epically overnight. We hope our results will stress the importance of PA intensity for glycemic control. Additionally, incorporating accelerometry into diabetes management technology should reduce the number of strategies the patient needs to take before, during and after PA.40 The previous statement should be combined with informed patient decision making and design of individualized strategies for sports execution according to PA loads, in line with Morrison et al41 findings on automated insulin delivery specific postexercise management strategies on meal-time dosing after resistance exercise.
Although glycemic and PA measurements of competitive-level exercise for people with T1D are available,42–45 less is known about T1D adults being active at an amateur level. Some of our study’s limitations were related to the measurement instruments used, given by the free-living conditions study design. First, CGM accuracy deteriorates during PA as compared with routine conditions46; therefore, this is an area requiring improvements to better assess glycemic variability between active and sedentary behaviour hours. Additionally, participants calibrated the enlite sensor twice per day, without assessing calibration quality. Second, DMES monitoring was self-reported, and inconsistencies exist between self-reported compensation techniques for exercise compared with observed ‘real-life’ actions.47 These may include: hypoglycemic or hyperglycemic events produced by carbohydrate counting errors, late or missed boluses, lipodystrophy, excessive hypo and hyperglycemia correction.47 In addition, reported DMES strategies before and after engaging in PA were surveyed once during our study, and further evaluation strategies are required to accurately report them in free-life conditions. While we used accelerometers to evaluate PA parameters in active participants, the measurement reactivity was low, which has been reported being higher on sedentary behaviour and light PA, although lower on MVPA with structured and planned exercise (especially in the free time domain) and during more than 7 days.48
Even though subgroup analysis gave interesting results, the decision to perform comparison between daytime versus nighttime and active versus sedentary behavior hours was made afterward with a post hoc evaluation. Non-parametric statistical tests were performed to mitigate any risk of bias, and results were confirmed with statistical power analysis. Further studies with larger participant’s population will be valuable to confirm statistical significance of our data. This is particularly relevant for the observed increased TBR2 overnight in the HL group, considering its clinical significancy (50% relative increment).
Finally, our results show that glycemic variability and TIR was in clinical targets for participants achieving recommendations for PA. However, even with all the beneficial PA outcomes in glycemic control, our study confirms hypoglycemia still presents a challenge for active people living with T1D. However, the main barrier of hypoglycemia fear associated with a lack of knowledge regarding exercise management49 might not apply in our study group. The problem discovered in this regard was underutilisation of diabetes strategies after exercise, which confirms the clinical need to increase awareness about the essential actions to be taken by people with T1D once PA has been completed.
This study was performed with participants using Medtronic 640G pumps, which do not represent the latest technology in this type of device. New technologies in diabetes, such as advanced hybrid closed loop systems, have shown less glycemic variability.50 However, more studies are still needed regarding the strategies to be used in different types of PA. Future diabetes technologies should be focused on decreasing the number of strategies that people with diabetes should apply for safe exercise practice.
Conclusions
Active T1D participants maintain glucose variability parameters of CV, mean glucose, MAGE, TIR and TAR, independent of PA load, within recommended levels for diabetes control, except for TBR that are above clinical suggested values, confirming hypoglycemia is still a risk associated with PA. People living with T1D with high PA intensity show a higher TBR than those in lower PA, during nighttime. Conversely, during waking hours, lower load PA participants show higher glycemic coefficient of variation in sedentary behavior than during AH. However, HL displays a larger MAGEs in the same hours compared. Therefore, improving management education for PA is necessary, especially after PA, to reduce glycemic variability and avoid hypoglycemia even when using a PLGS system. Technology for automatic detection of PA could improve integration of diabetes management strategies post-PA, reducing the challenges people with T1D still have to face practicing exercise in free-living conditions. Further studies will be necessary to understand the difficulties active people with T1D have in applying diabetes management exercise strategies to reduce hypoglycemic events after PA is completed.
Data availability statement
Data are available on reasonable request. Raw data sets.
Ethics statements
Patient consent for publication
Ethics approval
This study involves human participants and was approved by Ethics committee from Universidad Católica de Chile (ID 190725002). Participants gave informed consent to participate in the study before taking part.
Acknowledgments
We wish to thank Dr Carmen Gloria Bezanilla and Dr. José Eduardo Galgani F for their participation, contribution and comments.
References
Supplementary materials
Supplementary Data
This web only file has been produced by the BMJ Publishing Group from an electronic file supplied by the author(s) and has not been edited for content.
Footnotes
Contributors Conceptualization: DM-B and RS; data curation: DM-B and RS; formal analysis: DM-B, RS, JL, KD-C and MTO; funding acquisition: DM-B; guarantor: DM-B; investigation: DM-B, RS, JL and MTO; data acquisition: DM-B and MTO; methodology: DM-B; project administration: DM-B; resources: DM-B; software: DM-B and RS; supervision: DM-B; validation: DM-B and RS; visualization: DM-B, RS, JL, KD-C and MTO; writing original draft: DM-B, RS, JL and KD-C; writing review and editing: DM-B, RS, JL, KD-C and MTO. All authors had access to the study data and had reviewed and approved the final manuscript.
Funding This work was supported by the External Research Program of Medtronic (ERP-2019-12085).
Competing interests None declared.
Provenance and peer review Not commissioned; externally peer reviewed.
Supplemental material This content has been supplied by the author(s). It has not been vetted by BMJ Publishing Group Limited (BMJ) and may not have been peer-reviewed. Any opinions or recommendations discussed are solely those of the author(s) and are not endorsed by BMJ. BMJ disclaims all liability and responsibility arising from any reliance placed on the content. Where the content includes any translated material, BMJ does not warrant the accuracy and reliability of the translations (including but not limited to local regulations, clinical guidelines, terminology, drug names and drug dosages), and is not responsible for any error and/or omissions arising from translation and adaptation or otherwise.