Article Text

Abstract
Introduction Diabetes, characterized by elevated blood glucose levels, affects 13% of US adults, 95% of whom have type 2 diabetes (T2D). Social determinants of health (SDoH), such as food insecurity, are integral to glycemic control. The Supplemental Nutrition Assistance Program (SNAP) aims to reduce food insecurity, but it is not clear how this affects glycemic control in T2D. This study investigated the associations between food insecurity and other SDoH and glycemic control and the role of SNAP participation in a national socioeconomically disadvantaged sample.
Research design and methods Adults with likely T2D and income <185% of the federal poverty level (FPL) were identified using cross-sectional National Health and Nutrition Examination Survey (NHANES) data (2007–2018). Multivariable logistic regression assessed the association between food insecurity, SNAP participation and glycemic control (defined by HbA1c 7.0%–8.5% depending on age and comorbidities). Covariates included demographic factors, clinical comorbidities, diabetes management strategies, and healthcare access and utilization.
Results The study population included 2084 individuals (90% >40 years of age, 55% female, 18% non-Hispanic black, 25% Hispanic, 41% SNAP participants, 36% low or very low food security). Food insecurity was not associated with glycemic control in the adjusted model (adjusted OR (aOR) 1.181 (0.877–1.589)), and SNAP participation did not modify the effect of food insecurity on glycemic control. Insulin use, lack of health insurance, and Hispanic or another race and ethnicity were among the strongest associations with poor glycemic control in the adjusted model.
Conclusions For low-income individuals with T2D in the USA, health insurance may be among the most critical predictors of glycemic control. Additionally, SDoH associated with race and ethnicity plays an important role. SNAP participation may not affect glycemic control because of inadequate benefit amounts or lack of incentives for healthy purchases. These findings have implications for community engaged interventions and healthcare and food policy.
- control
- diabetes mellitus, type 2
- nutrition policy
- healthcare disparities
Data availability statement
Data are available via the NHANES website cited in reference 15.
This is an open access article distributed in accordance with the Creative Commons Attribution Non Commercial (CC BY-NC 4.0) license, which permits others to distribute, remix, adapt, build upon this work non-commercially, and license their derivative works on different terms, provided the original work is properly cited, appropriate credit is given, any changes made indicated, and the use is non-commercial. See: http://creativecommons.org/licenses/by-nc/4.0/.
Statistics from Altmetric.com
WHAT IS ALREADY KNOWN ON THIS TOPIC
Food insecurity is associated with risk for diabetes and poor control of diabetes in multiple regional and national samples.
In some small studies, Supplemental Nutrition Assistance Program (SNAP) participation modified the effect of food insecurity on diabetes control.
WHAT THIS STUDY ADDS
In a national population sample, restricted to individuals with incomes <185% of the federal poverty level, food insecurity was no longer significantly associated with diabetes control in a multivariable model adjusted for other factors including health insurance status.
Having no insurance was among the most significant predictors of poor diabetes control.
SNAP participation did not modify the effect of food insecurity on diabetes control in this sample.
HOW THIS STUDY MIGHT AFFECT RESEARCH, PRACTICE OR POLICY
Programs addressing one social determinants of health (SDoH) (food insecurity) must also be equipped to address additional SDoH (health insurance) in order to have optimal impact on health outcomes.
Introduction
Diabetes mellitus (DM) is a metabolic disease defined by chronically elevated blood glucose levels. DM is an umbrella term for numerous subtypes, but this manuscript focuses on the most common form of diabetes, type 2 diabetes (T2D). T2D is most often diagnosed in adulthood, but there are increasing rates in childhood and adolescence. It has a known genetic component and a strong association with diet, lifestyle and obesity. It is characterized by both insulin resistance and defective insulin secretion from the pancreatic cells, resulting in functional insulin deficiency.
DM affects approximately 13% of adults in the USA, disproportionately impacting racial and ethnic minoritized populations, and 95% of cases are T2D.1 Further, the American Diabetes Association estimated the cost of DM at $327 billion in 2017, up 26% from 2012. Individuals with DM have medical costs that are 2.3 times higher than individuals without diabetes.2
Social determinants of health (SDoH) encompass ‘conditions in the places where people live, learn, work, and play that affect a wide range of health risks and outcomes’.3 These include the environmental, systemic, social, economic, societal and other extrinsic factors that impact quality of life and worsen vulnerability to chronic illness. Self-management is integral to T2D control specifically, and thus, T2D is particularly affected by SDoH.4 Food insecurity, defined as limited or uncertain access to adequate food, is a social determinant with specific implications for T2D given the importance of nutrition in the development and management of this disease.5 The stress of limited food options, hunger, and poor nutrition can increase the risk for T2D. Subsequently, frequent primary care visits, prescription medication, and supplies needed to manage T2D increase healthcare costs,2 and poor nutrition may inhibit disease management, further exacerbating spending on healthcare.
Food insecurity is associated with both the development of diabetes and diabetes control in large national samples and smaller urban samples. Using data from the National Health and Nutrition Examination Survey (NHANES) 1999–2002, with adjustment for common confounders, food insecurity was associated with 2.2 (95% CI 1.2 to 3.9) times higher risk of developing diabetes.6 A systematic review and meta-analysis including >55 million adults concluded that food insecurity was significantly associated with T2D risk (pooled OR 1.27, 95% CI 1.11 to 1.42).7 Additionally, using NHANES 1999–2008, food insecure participants were 1.53 (95% CI 1.07 to 2.19) times more likely to have a HbA1c >9.0% (75 mmol/mol).8 Two studies in urban, low-income populations demonstrated similar associations between food insecurity and poor glycemic control.9 10 Moreover, food insecurity has also been associated with higher rates of hypoglycemia.11
Government programs, specifically the Supplemental Nutrition Assistance Program (SNAP), provide assistance to alleviate food insecurity. Individuals are eligible for SNAP if they have a gross income <130% of the federal poverty level (FPL) and net income <100% of the FPL and have countable resources (not including housing, Supplemental Security Income, Temporary Aid for Needy Families, or retirement/pension) below a certain threshold ($2750 or $4250 if one household member is 60 years or older).12 Additionally, everyone in the household must have, or have applied for, a social security number and there may be waiting periods for some lawfully present non-citizens. Application occurs at the state level, there are typically work requirements, and benefits are calculated based on the expectation that households spend 30% of resources on food. Benefits can be used for ‘staple foods’ such as fruits, vegetables, meat, poultry, fish, dairy, bread, cereal, seeds/plants that produce food, snacks and non-alcoholic beverages. Benefits cannot be used for alcohol or tobacco products, vitamins or supplements, non-food items, and hot prepared foods.12 13 It is unclear if and how this program affects glycemic control for individuals with T2D or how it modifies the effect of food insecurity on glycemic control for these individuals, as prior nationally representative studies have not examined this association. A single study of 407 individuals (>80% non-Hispanic black) receiving care in an urban medical center in Philadelphia showed that food insecure individuals participating in SNAP had a lower risk for poor glycemic control than food insecure individuals not participating in SNAP (adjusted OR (aOR) 0.35 (95% CI 0.13 to 0.91)) in an adjusted model.10 SNAP appeared to have a similar modifying effect among 189 Cambodian Americans in a diabetes prevention trial.14 To address this gap in the literature and examine the effect of SNAP at the national level, we evaluated the association between food insecurity, SNAP participation and glycemic control in a national population sample of individuals with T2D and low income (<185% of the FPL).
Research design and methods
Sample population
We combined questionnaire, examination, and dietary recall data from six consecutive waves (2007–2018) of the Centers for Disease Control and Prevention’s (CDC) NHANES, which is a public data source releasing survey data in 2-year cycles, providing cross-sectional data on a random national sample. Individuals are offered an in-home interview and physical examination and labs at a Mobile Examination Center. Data are assigned a sampling weight to account for selection bias, oversampling and non-response to approximate the US non-institutionalized population from Census Bureau data.15 As a result of the COVID-19 pandemic, NHANES suspended field operations in March 2020. The NHANES 2019–2020 cycle was therefore not completed and could not be included in this analysis.
Our analytic sample included all adults (≥18 years of age) with diabetes who had an income level ≤185% of the FPL from NHANES cycles 2007–2018. This income threshold was chosen to encompass individuals eligible for SNAP benefits (income <130% of the FPL) and those with borderline eligibility (131%–185% of the FPL) as individuals frequently cycle on and off of assistance programs. Diabetes diagnosis was defined as either self-report (‘have you ever been told by a doctor or other health professional that you have diabetes or sugar diabetes?’) or laboratory values. Individuals with a fasting plasma glucose level over 125 mg/dL (6.9 mmol/L) or HbA1c ≥6.5% (48 mmol/mol), but without self-reported diagnosis of diabetes, were considered to have undiagnosed diabetes. We excluded pregnant women and individuals who had both been diagnosed with diabetes before age 18 and were currently being treated with insulin as those individuals are more likely to have gestational diabetes (GDM) or type 1 diabetes (T1D), respectively. Individuals who did not complete the day one 24-hour dietary recall interview or were missing the HbA1c outcome were also excluded from analysis. See figure 1 for sample construction flow diagram.
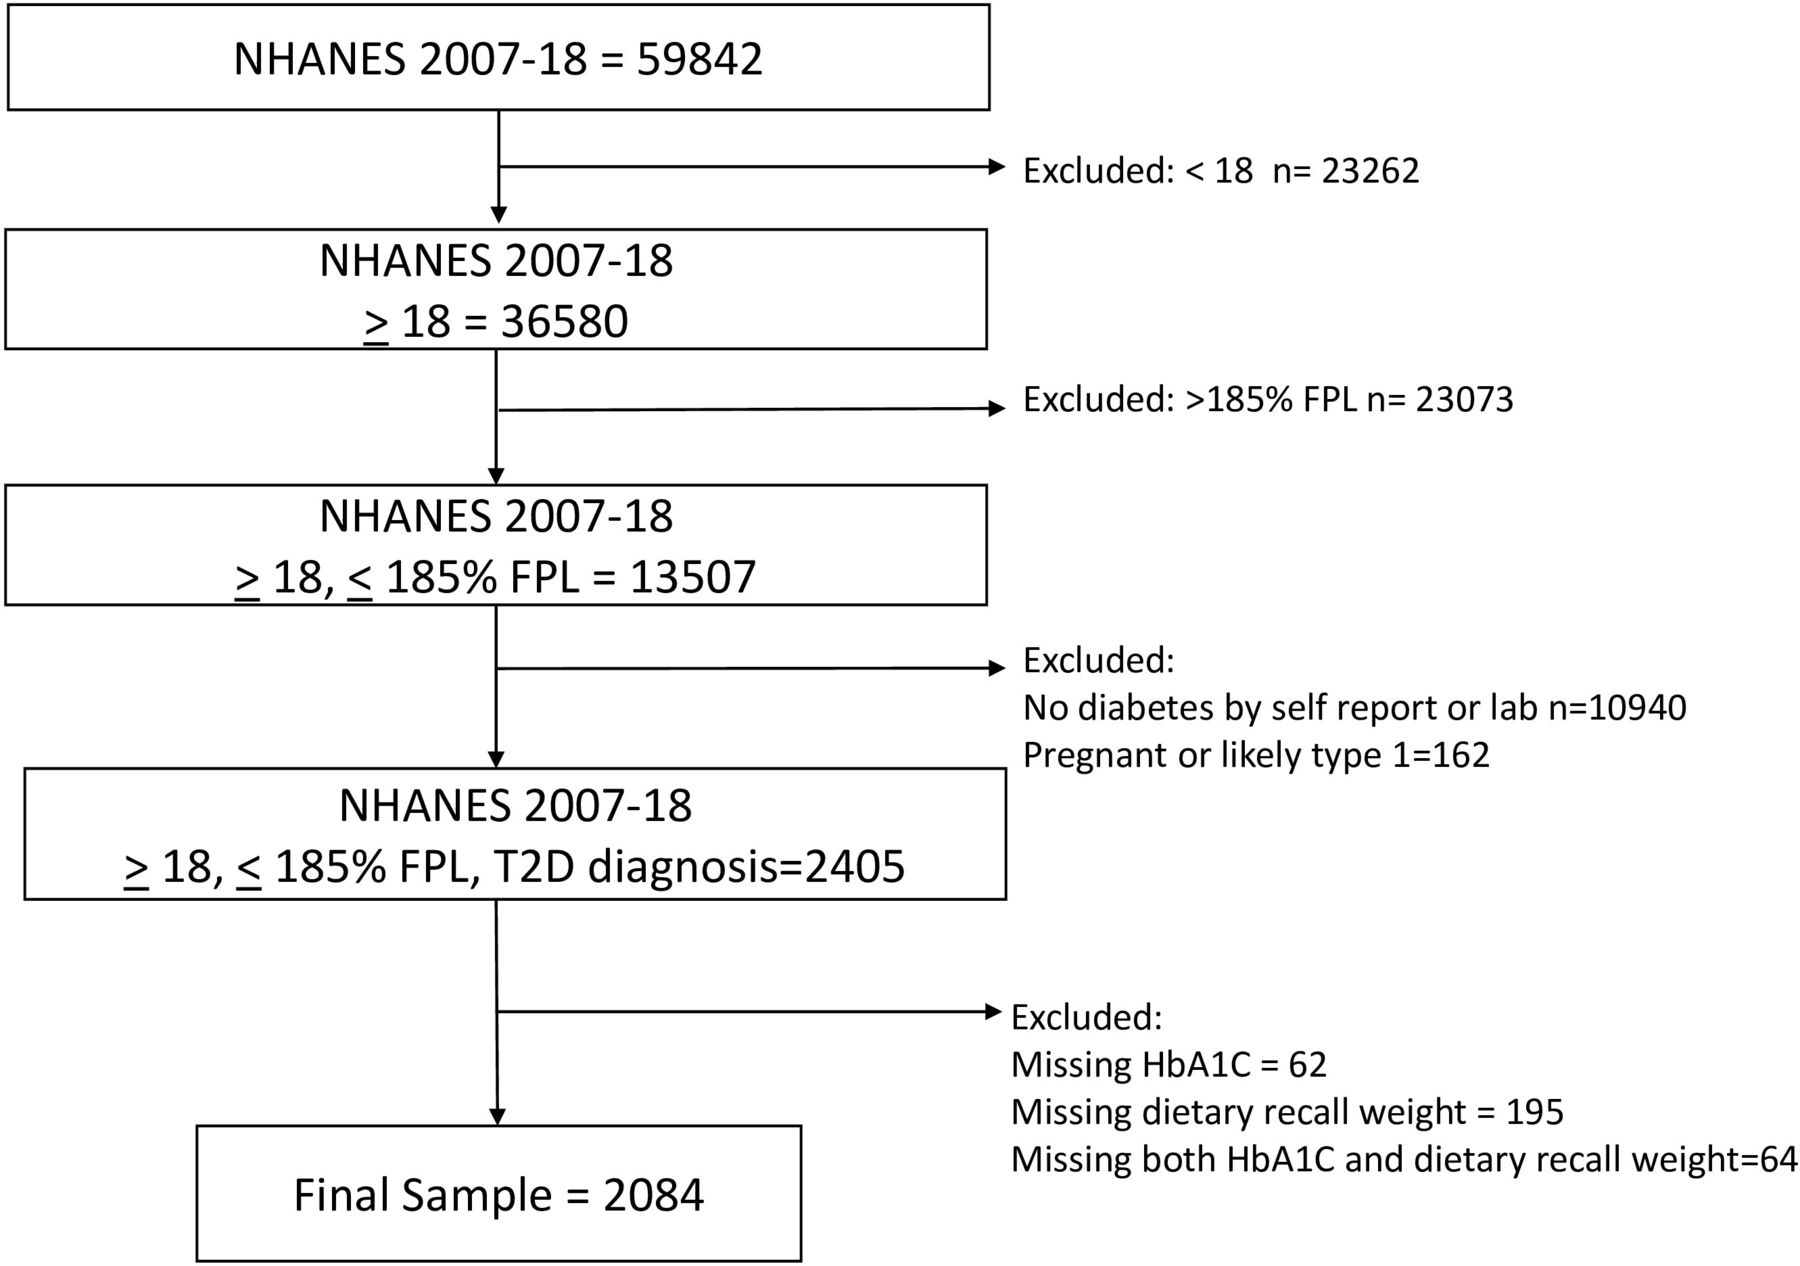
Description of sample construction from NHANES 2007–2018 data with inclusion and exclusion criteria. NHANES, National Health and Nutrition Examination Survey.
Primary outcome
Our outcome of interest was glycemic control. For those without complications of diabetes, glycemic control was categorized as HbA1c ≤7.0% (53 mmol/mol) for those under 65 and ≤7.5% (58 mmol/mol) for those 65 or older. For those with complications of diabetes, control was categorized as HbA1c ≤8.0% (64 mmol/mol) for those under 65 and ≤8.5% (69 mmol/mol) for those 65 or older. This is consistent with guidelines allowing individualization of HbA1c goals and with prior literature.16 17 An individual was considered to have diabetes complications if they self-reported a diagnosis of retinopathy, kidney disease or cardiovascular disease (congestive heart failure, coronary heart disease, angina/angina pectoris, heart attack or stroke).16
Primary predictors
Food security was assessed using the participant’s responses to the 10-item US Adult Food Security Survey Module within NHANES.18 As in prior studies, individuals with low or very low food security (3+ affirmative responses) were considered to be food insecure, and individuals with marginal or full food security (0–2 affirmative responses) were considered to be food secure.8 Participants answered a series of questions about whether they or anyone in their household, currently, or in the past 12 months, had received SNAP or food stamp benefits (FSQ171 (2007–2012); FSQ012 (2013–2018)). They then reported the amount of time since they received those benefits (FSD225).19 SNAP or food stamp participation was defined as reporting receipt of benefits within 90 days of the survey.
Covariates
Missing values for body mass index (BMI) (n=121) and depression score (n=282) were imputed using a hot-deck method with imputation cells of age, race, gender, marital status, and education.20 Individuals missing dietary data were excluded because they did not have a dietary recall survey weight. We investigated covariates with known associations with glycemic control. Sociodemographic factors that were included in bivariate analyses were race/ethnicity (non-Hispanic white, non-Hispanic black, Hispanic, or another race/ethnicity); gender; marital status (married or living with partner, widowed/divorced/separated/never married); language spoken at home (English ≥50% of the time, English <50% of the time); and income as %FPL (≤130% of FPL, 131%–185% of FPL). Comorbidity covariates included self-report of clinically diagnosed high blood pressure and high cholesterol, obesity (BMI≥30), and major depression (score of 10+ on the Patient Health Questionnaire depression scale (PHQ-9).21 Gender on the NHANES questionnaire during the study period only had a binary response option and instructed the interviewer to ask ‘if not obvious’. We report this variable as gender, rather than sex, to be consistent with the variable label but recognize that this may not represent gender identity.
As part of the home interview portion of the NHANES, participants report all prescription medications that they are currently taking. We categorized medication regimens into insulin alone or in combination and oral or non-insulin injectable medication. Any participant who did not report a diabetes medication was considered to be diet controlled. Other covariates relating to health perception and diabetes management included length of time since diagnosis with diabetes; self-reported general health (excellent, very good, good, fair, poor); moderate or vigorous physical activity (<150 min/week, ≥150 min/week); and carbohydrate intake, from the day 1 dietary recall. We included carbohydrate intake (<180 g, >180 g) and carbohydrate intake specifically from sugar sweetened beverages (≤15 g, >15 g). Healthcare utilization variables included insurance status (private, Medicare, other government insurance, Medicaid, self-pay or no insurance); whether the participant had a routine place to go for healthcare; and the number of times that they had received healthcare in the previous year (0–1 visit, 2–9 visits, 10+ visits).
Statistical analysis
Survey procedures were used to account for complex survey design and weighting. We combined six consecutive NHANES cycles and constructed combined survey weights using the day one dietary recall weights per NHANES recommendation. Bivariate analyses were conducted between the primary outcome, primary predictors and covariates described above. We used t-tests and χ2 tests as appropriate to assess the relationship of each independent variable with glycemic control. Variables were candidates for inclusion in the final model when p<0.1 or if they were considered clinically relevant. We used multivariable logistic regression to assess the independent association of food insecurity and SNAP participation with glycemic control, including the assessment of an interaction term, with introduction of covariates in blocks (demographic, clinical comorbidities and diabetes management strategies, healthcare utilization). The final statistical model was adjusted for gender, race/ethnicity, marital status, language spoken at home, high blood pressure diagnosis, diabetes management strategy, total carbohydrate intake, physical activity, health insurance, and number of visits to a healthcare provider in the last year. Age and micro/macrovascular comorbidities were not included as covariates in adjusted models, as their effects were incorporated in the calculation of the glycemic control outcome as described above. All analyses were conducted using SAS V.9.4 (SAS Institute). Data are publicly available and deidentified and thus not considered human subjects research under the 2018 common rule.
Results
Our final analytic sample consisted of 2084 individuals (n=1575 who self-reported diagnosis by a doctor and an additional n=509 with elevated fasting glucose or HbA1c) (figure 1).
Table 1 describes sample and population characteristics of adults with diabetes. The majority of the population were 40 years or older (n=1916, 89.7%), 55% (n=1080) were female, 18% (n=495) identified as non-Hispanic black and 25% identified as Hispanic (n=726). Most adults with diabetes in this sample also reported high blood pressure (n=1400, 67.3%), high cholesterol (n=1154, 58.8%) and obesity (n=1220, 63.4%). Nineteen per cent of the sample (n=376) had a PHQ9 score indicating major depression, and 59% (n=1254) reported less than 150 min/week of moderate or vigorous physical activity. A minority of the sample reported good, very good or excellent health (n=873, 44.1%). The majority of individuals required some medication for diabetes management (n=1181, 55.2%), with 17.1% requiring insulin (n=342). The majority of the sample were not privately insured with self-pay and uninsured (n=431, 21.5%), Medicare recipients (n=472, 20.5%), and Medicaid recipients (n=493, 23.4%) comprising approximately equal proportions of the sample. Over one-third (n=756) of adults with diabetes reported some level of food insecurity (low security (n=421, 18.7%) and very low security (n=335, 17.4%)), while 41% (n=821) reported participating in SNAP within 90 days of the NHANES survey.
Sample and population characteristics, adults with diabetes and income <185% of FPL NHANES 2007–2018*
Table 2 shows bivariate comparisons by diabetes control status. Individuals with an uncontrolled HbA1c (n=654) comprised 31% of the sample. Notably, food insecurity and glycemic control were found to be significantly associated (p=0.046). SNAP participation, however, was not significantly associated with glycemic control (p=0.562). Individuals with Hispanic or another race and ethnicity were more likely to have poor glycemic control, as were individuals who spoke English <50% of the time at home (p<0.0001). There was no difference in glycemic control within the Hispanic population when compared with Mexican American versus other Hispanic or birth within the USA versus birth outside the USA (online supplemental table S1). Individuals with high blood pressure in this sample were less likely to have poor glycemic control (uncontrolled n=399, 60.3% vs controlled n=1001, 70.4%; p=0.004), whereas high cholesterol, obesity and depression were not significantly associated with glycemic control. Any insulin use was associated with greater likelihood of poor glycemic control (uncontrolled n=175, 26.2% vs controlled n=167, 13.1%; p<0.0001). Insurance type was also found to be significantly associated with glycemic control (p<0.001), where adults with diabetes who also reported self-pay or lack of insurance were more likely to be uncontrolled (n=208, 32.6% vs controlled n=223, 16.6%).
Supplemental material
Bivariate comparisons by diabetes control status in sample of adults with diabetes and income <185% of FPL NHANES 2007–2018
Table 3 presents unadjusted and adjusted associations of food insecurity, SNAP participation, and the likelihood of poor glycemic control, with covariates introduced in blocks in subsequent models. Food insecure individuals are 33% more likely to have poor glycemic control in an unadjusted model (OR=1.330, 95% CI 1.000 to 1.768). However, food insecurity was not significantly associated with glycemic control in adjusted models. There was also no difference in the effect of food insecurity on glycemic control by SNAP participation, as demonstrated by an insignificant food insecurity-SNAP interaction term (p=0.578) (online supplemental table S2). The strongest associations with poor glycemic control in the fully adjusted model are race and ethnicity (ref: non-Hispanic white (Hispanic aOR=2.068, 95% CI 1.337 to 3.199; another race/ethnicity aOR=1.946, 95% CI 1.177 to 3.220)); need for oral or injectable diabetes medication or insulin (ref: diet controlled (oral or injectable, non-insulin aOR=2.265, 95% CI 1.606 to 3.196; any insulin aOR=5.383, 95% CI 3.554 to 8.154)); and self-pay or no insurance (ref: private insurance (aOR=2.199, 95% CI 1.456 to 3.322)). There was not a difference in glycemic control among those receiving Medicaid compared with those on private insurance (aOR=1.117, 95% CI 0.787 to 1.585). Interaction terms between food insecurity and diabetes management strategy and food insecurity and insurance status were not significant (online supplemental table S2). There was no collinearity demonstrated among variables in the final adjusted model.
Unadjusted and adjusted association of food insecurity, SNAP participation and likelihood of uncontrolled HbA1c with sequential introduction of covariates in a sample of adults with diabetes and income <185% of FPL NHANES 2007–2018
Discussion
This study expands the existing literature on the association between food insecurity and glycemic control in the context of SNAP participation and highlights the critical impact of multiple SDoH on diabetes control. Specifically, there was a significant association between poor glycemic control and race and ethnicity (particularly Hispanic ethnicity or another race/ethnicity) that remained in adjusted models. Individuals who spoke English <50% of the time at home were more likely to have an uncontrolled HbA1c in bivariate comparisons but this did not remain significant in the multivariable model. Lack of insurance was also strongly associated with poor glycemic control in adjusted models, a finding consistent with previously published work.22 Our study differs from previously published work in this area by focusing on a low-income population (income <185% of FPL) in the nationally representative NHANES data. While a prior study demonstrated an association between food insecurity and glycemic control in the NHANES population with diabetes,8 our focused examination on low-income individuals demonstrates the association between food insecurity and glycemic control was attenuated by additional factors, including access to health insurance. Additionally, while two smaller studies in specific populations showed that SNAP participation was able to modify the effect of food insecurity on glycemic control,10 14 we did not demonstrate this effect modification in this national sample. Reasons for this include, but are not limited to, differences in sample population, demographics, and exclusion criteria. Specifically, both of these smaller studies had very few uninsured participants. Additional strengths of our study include the use of personalized HbA1c goals, according to age and comorbidities, to define glycemic control. We also incorporated diet and exercise data obtained by the NHANES to examine all aspects of diabetes management more fully.
Notably, individuals in our study who received Medicaid did not have significantly different control from individuals with private insurance. While 40 states, including the District of Columbia, have now opted to expand their Medicaid programs under the Affordable Care Act to include all individuals with incomes <138% of FPL, there are 11 states that have not yet adopted expansion and additional states struggling with implementation of expansion.23 A study using difference-in-difference methodology and NHANES data 2005–2016 demonstrated that individuals living in states with Medicaid expansion saw a significant improvement in systolic blood pressure, HbA1c, and LDL-cholesterol compared with individuals in states without expansion.24 While our study does not address Medicaid expansion effects directly, no difference in poor glycemic control among individuals on Medicaid compared with private insurance signals the critical importance of this government insurance program for low-income individuals.
Food as Medicine programs have garnered significant attention in recent years, particularly for conditions such as T2D that are sensitive to dietary modification. Interventions through food banks that involve prepackaged or medically tailored meals show positive effects on food insecurity, healthy eating index, fruit and vegetable consumption and food-medication trade-offs, and studies are ongoing to determine the effect of these programs on HbA1c.25–28 Medical prescriptions for fresh vegetables improved multiple cardiometabolic risk factors in a pre-post comparison among predominantly Mexican Americans with T2D.29 Our findings highlight that programs addressing one SDoH (food insecurity) must also be equipped to address additional SDoH (health insurance, racial/ethnic discrimination, and language barriers) in order to have optimal impact on health outcomes.
We hypothesized that SNAP participation would attenuate the effect of food insecurity on glycemic control by subsidizing the cost of food, and smaller studies have demonstrated this effect.10 14 Moreover, SNAP participation has been associated with decreased healthcare expenditures using national data.30 However, contrary to our hypothesis, SNAP participation was not associated with glycemic control and did not modify the effect of food insecurity on glycemic control. One potential reason for this finding is that SNAP does not focus on dietary quality or encouraging components of the T2D diet.31 Further, the SNAP-Ed education program incorporates MyPlate, a free, interactive tool created by the Dietary Guidelines for Americans to help individuals build healthy, balanced plates, and participation improves dietary quality,32 33 but the education does not specifically focus on carbohydrate restriction for diabetes management. Moreover, we chose to include individuals who were near SNAP eligibility based on income criteria, but were not able to account for other aspects of eligibility such as resources, work requirements, and immigration status.
Programs that enhance SNAP benefits to encourage use of benefits at farmer’s markets, provide additional money for produce purchases, or restrict sugar sweetened beverage purchases have demonstrated increased healthy food purchases, decreased consumption of unhealthy foods and improved dietary quality. However, the effect on health outcomes has not yet been studied, and there are barriers to incentive programs related to awareness and accessibility.34–39 Programs combining incentives for healthy foods and disincentives for unhealthy foods are most cost-effective.40 Finally, SNAP may not have modified the effects of food insecurity on glycemic control because benefit levels during the study period were too low to afford adequate nutrition options. In 2021, SNAP benefits increased by 25%, potentially remediating this problem; however, past studies demonstrate that an increase in the amount of SNAP benefits without other incentives for healthy purchases has not improved dietary quality.41
Among our significant findings, individuals who self-identified as Hispanic or another race/ethnicity were more likely to have poor glycemic control than individuals self-identified as non-Hispanic white. This difference remained when adjusted for language spoken at home, highlighting the importance of additional SDoH in diabetes control. One possible explanation is that culturally tailored diabetes self-management education programs have not been widely implemented. Programs that culturally tailor information are associated with improved diabetes control,42–45 but these are not available at large scale. Moreover, while race and ethnicity are measured in surveys, they serve as a proxy for numerous structural, environmental, and social factors that affect health. Hence, differences in health seen by racial and ethnic groups represent multiple unmeasured effects, including but not limited to, the effects of acculturation and structural racism, as opposed to biological differences.
Our data also suggested that need for diabetes medication, particularly insulin, had a significant association with poor glycemic control, even after adjusting for numerous other factors. This is likely a marker for the severity of disease, as insulin is typically added later in the course of T2D after other management strategies have failed, or in cases when the HbA1c is extremely elevated. Nonetheless, in the context of a disease that is so impacted by lifestyle, the association of insulin and lack of health insurance with poor glycemic control raises the possibility of food-medication trade-offs and cost-related medication underuse among low-income food insecure individuals. Existing literature demonstrates that individuals with diabetes have higher odds of financial hardship from medical bills, food insecurity, cost-related medication underuse and foregone/delayed medical care than those without diabetes.46 Individuals with diabetes are more likely than those without to report spending less on basic needs, principally food, to pay for medication,47 and some studies have demonstrated that food interventions have alleviated food-medication trade-offs for individuals with diabetes.26 27 The current study is not able to explore this fully, but these factors must be incorporated and assessed in interventions seeking to address SDoH and health outcomes in this population.
Our study has some important limitations. First, we used HbA1c as our measure for glycemic control because this was readily available in the NHANES data. However, food insecure individuals may not only struggle with hyperglycemia but also hypoglycemia depending on food access. If hypoglycemia alternates with hyperglycemia, an individual’s HbA1c may not rise to a level that is considered poorly controlled. At least one study has demonstrated improvement in continuous glucose monitor (CGM) time in range during meal delivery for individuals with T2D,48 and CGM has demonstrated an ability to differentiate individuals who have T2D or who are at risk or pre-DM in a predominantly Hispanic sample.49 Thus, assessment of glycemic variability using CGM may be a better metric of control in future studies, although not available in national survey data. Next, we were unable to delineate diabetes type with certainty. This affects how the data can be understood and applied, since results could potentially differ between T1D and T2D. However, we attempted to mitigate this limitation by excluding individuals who were pregnant and individuals on insulin with diagnosis before age 18. While this likely excluded some individuals with T2D diagnosed before age 18 and included individuals with latent autoimmune diabetes in the adult, it is unlikely to substantially change the results given the size of the population.
Another important limitation of our study was our inability to account for detailed aspects of race and ethnicity, including the potential effect of acculturation, with publicly available NHANES data. We used a race and ethnicity variable that was consistent across our study period (RIDETH1); however, this variable limits characterization of the Hispanic community to ‘Mexican American’ and ‘Other Hispanic’, effectively limiting the opportunity to represent the diversity of this community in these data. Previous work has characterized rates of diabetes ranging from 12.3% among South Americans to 24.6% among Mexican Americans in NHANES data 2011–2016, but has not specifically looked at glycemic control in these subgroups.50 We also did not have information on immigration status or other measures of acculturation, outside of language most frequently used at home, and thus there were potentially multiple unmeasured effects, which could explain the differences in glycemic control that we saw for the Hispanic community.51
While SNAP and health insurance eligibility rest on similar factors, we tried to minimize variation by limiting the population to individuals with income <185% of FPL. Everyone in our sample met or approached income eligibility for SNAP. Notably, there was no difference in glycemic control among those with income <130% of FPL and 131–185% of FPL. Health insurance eligibility is more complicated, and uninsured individuals may be immigrants without documentation, working in jobs that do not provide private health insurance, or living in a state where Medicaid has not been expanded. The Affordable Care Act was implemented during the last several years of the study period and altered the health insurance landscape in different ways by state. This is difficult to completely disentangle with the available data and is a limitation of the study.
This analysis investigates recent participation in SNAP, a federal food assistance program, but is not able to consider regional, state, or city-level policies that specifically address food security. Geographic identifiers are not released in the publicly available NHANES data to protect participant confidentiality. Similarly, it was not possible to incorporate any local variability in SNAP eligible items over the study period. Policy changes, economic recessions, and rising unemployment rates are a few factors that have contributed to overall significant growth in SNAP participation since 2001, and SNAP benefits increased by 14% in 2009.52
As with all survey data, recall bias may have been present during the interview component of the NHANES study. Individuals may have incorrectly recalled that they were diagnosed with diabetes or not remembered a diabetes diagnosis. Some of this was mitigated through the inclusion of individuals with abnormal HbA1c or fasting glucose on laboratory testing. The exclusion of individuals who were missing dietary data may have introduced selection bias. Struggling with dietary recall could indicate poor nutrition, and thus, these individuals could be more likely to exhibit poor glycemic control. The questions about the primary predictors of interest (food insecurity and SNAP participation) were about the 30–90 days prior to the interview, and while subject to recall bias, the narrow, recent timeframe may limit this. As a cross-sectional study, we cannot infer causation between our predictors and covariates and study outcome. Finally, there were potential unmeasured covariates that we could not account for, such as medication underuse and acculturation.
Despite these limitations, our study assessed a large, nationally representative, population of adults with diabetes and low income and considered the tangible effect of SDoH on disease management. Our findings highlight a gap in care for low-income adults with diabetes, particularly those who identify as Hispanic or another race or ethnicity, and individuals who are uninsured. Future studies should examine glycemic variability in addition to HbA1c as an outcome measure for diabetes control in the food insecure. As highlighted here, health insurance is critical for diabetes control and future interventions that address food security could also address health insurance access. Finally, from a policy perspective, examination of the ‘spillover’ effects of Medicaid expansion on food security and the effects of SNAP expansion on healthcare outcomes, with attention to food and medication/supply trade-offs, could illuminate additional needs and inform future interventions to improve diabetes management for marginalized communities.
Data availability statement
Data are available via the NHANES website cited in reference 15.
Ethics statements
Patient consent for publication
Ethics approval
Not applicable.
Acknowledgments
The authors would like to acknowledge participants in the NHANES surveys and CDC NHANES survey staff.
References
Supplementary materials
Supplementary Data
This web only file has been produced by the BMJ Publishing Group from an electronic file supplied by the author(s) and has not been edited for content.
Footnotes
Contributors OA conceived the study question, participated in data analysis and interpretation, and drafted and edited the manuscript. SH performed data management and data analysis and drafted and edited the manuscript. The contributions of OA and SH to the manuscript were equivalent. CJH mentored OA in study design, oversaw data analysis and interpretation, and drafted and edited the manuscript. CJH is the responsible for the overall content as the guarantor of this work.
Funding This work was supported by the National Institute Diabetes, Digestive and Kidney Diseases (grant number T32DK007120), the National Institute for Child Health and Development (grant number K23HD096204), the Siteman Cancer Center, and the Barnes Jewish Hospital Foundation.
Competing interests CJH consults for Teladoc Health and spouse consults for Eli Lilly and Merck. OA and SH have no conflicts to declare.
Provenance and peer review Not commissioned; externally peer reviewed.
Supplemental material This content has been supplied by the author(s). It has not been vetted by BMJ Publishing Group Limited (BMJ) and may not have been peer-reviewed. Any opinions or recommendations discussed are solely those of the author(s) and are not endorsed by BMJ. BMJ disclaims all liability and responsibility arising from any reliance placed on the content. Where the content includes any translated material, BMJ does not warrant the accuracy and reliability of the translations (including but not limited to local regulations, clinical guidelines, terminology, drug names and drug dosages), and is not responsible for any error and/or omissions arising from translation and adaptation or otherwise.