Article Text

Abstract
Objective Non-alcoholic fatty liver disease (NAFLD) is prevalent in patients with type 2 diabetes. Here, we estimate the proportion of patients with type 2 diabetes that should be referred to hepatologists according to the European Association for the Study of the Liver (EASL)-European Association for the Study of Diabetes (EASD)-European Association for the Study of Obesity (EASO) Guidelines and evaluate the association between non-invasive biomarkers of steatosis and fibrosis and diabetic complications.
Research design and methods This is a retrospective analysis of type 2 diabetes patients who attended on a regular basis our diabetes clinic between 2013 and 2018 (n=2770). Steatosis was assessed using Fatty Liver Index (FLI), Hepatic Steatosis Index and NAFLD Ridge Score and fibrosis using NAFLD Fibrosis Score (NFS), Fibrosis-4 (FIB-4), aspartate aminotransferase (AST) to platelet ratio index (APRI) and AST/alanine aminotransferase (ALT) ratio. Outcome measures were altered albumin excretion rate (AER), chronic kidney disease (CKD) and cardiovascular disease (CVD).
Results The prevalence of advanced fibrosis varied from 1% (APRI) to 33% (NFS). The application of the guidelines using a sequential combination of FLI and FIB-4 would lead to referral of 28.3% of patients when using standard FIB-4 cut-offs, while this number dropped to 13.4% when age-adjusted FIB-4 thresholds were applied. A higher prevalence of altered AER was associated with liver steatosis (FLI: OR: 3.49; 95% CI 2.05 to 5.94, p<0.01), whereas liver fibrosis was associated with CKD (FIB-4: OR: 6.39; 95% CI 4.05 to 10.08, p<0.01) and CVD (FIB-4: OR: 2.62; 95% CI 1.69 to 4.04, p<0.01).
Conclusions While specific fibrosis scores identify different proportion of patients with advanced fibrosis, the use of age-adjusted FIB-4 cut-offs leads to a drop in gray-zone results, making referrals to hepatologists more sustainable. Interestingly non-invasive biomarkers were consistently associated with a different pattern of diabetic complications.
- type 2 diabetes
- NAFLD
- screening strategies
- non-alcoholic seatohepatitis
This is an open access article distributed in accordance with the Creative Commons Attribution Non Commercial (CC BY-NC 4.0) license, which permits others to distribute, remix, adapt, build upon this work non-commercially, and license their derivative works on different terms, provided the original work is properly cited, appropriate credit is given, any changes made indicated, and the use is non-commercial. See: http://creativecommons.org/licenses/by-nc/4.0/.
Statistics from Altmetric.com
Significance of this study
What is already known about this subject?
Non-alcoholic fatty liver disease (NAFLD) is common in patients with type 2 diabetes and the EASL-EASD-EASO guidelines recommend systematic screening in this population.
NAFLD is a risk factor for diabetic complications.
What are the new findings?
The application of the guidelines to patients with type 2 diabetes using sequentially Fatty Liver Index (FLI) and Fibrosis-4 (FIB-4) would lead to referral to hepatologists of 13.4% of patients.
Biomarkers of steatosis showed an association with microalbuminuria, whereas biomarkers of fibrosis were associated with cardiovascular and renal complications.
How might these results change the focus of research or clinical practice?
Our results show that applying the aforementioned guidelines in everyday clinical practice would not probably lead to over-referral to hepatologists when a combination of FLI and FIB-4 is used.
Introduction
Non-alcoholic fatty liver disease (NAFLD) occurs very commonly in patients with type 2 diabetes mellitus, with a prevalence of 55%–68%1 due to the often superimposable condition of insulin resistance.2 The degree of fibrosis represents the strongest predictor of liver-specific and all-cause mortality3 4 and although most individuals with NAFLD do not reach the cirrhotic stage, patients with type 2 diabetes seem to progress faster and are at higher risk of steatohepatitis (NASH)5 6 and liver-related mortality.7 For these reasons, identifying individuals with, or at higher risk for advanced fibrosis among the large NAFLD population is clinically useful for the patient and challenging for the physician. With this purpose the EASL-EASD-EASO Guidelines recommend to routinely screen type 2 diabetes patients for the presence of NAFLD and to assess the presence of advanced fibrosis in high risk individuals.8 Another reason to identify patients with NAFLD is that beside its effect on the liver, a growing body of evidence showed that this condition is also associated with an increased incidence of cardiovascular (CVD) events,9 10 chronic kidney disease (CKD),11 and diabetic microvascular complications such as nephropathy, retinopathy11 and sensitive-motor12 and autonomic neuropathy.13 In the present study our aim was: (1) to test the sustainability in terms of specialist referrals of the diagnostic flow-chart proposed by the EASL-EASD-EASO Guidelines using sequentially non-invasive biomarkers of steatosis and fibrosis in patients with type 2 diabetes and (2) to explore the association of these biomarkers with CVD and CKD morbidity.
Materials and methods
Patients
We retrospectively reviewed medical records of all patients aged >18 years with a diagnosis of type 2 diabetes who attended on a regular basis our diabetes clinic at Policlinico di Monza between 2013 and 2018. Based on patients history and available previous medical records we excluded from the analysis individuals with secondary causes of hepatic steatosis, chronic liver disease (hepatitis C, hepatitis B, Wilson Disease, autoimmune hepatitis), liver complications (liver failure, ascites, encephalopathy, variceal bleeding or hepatocellular carcinoma) or significant alcohol consumption (evaluated through routine nutritional history performed in the diabetes clinic or past medical records).
Flow-chart for the screening of NAFLD
The above-mentioned EASL-EASD-EASO Guidelines recommend to screen the presence of NAFLD through a first step based on the use of ultrasound or serum biomarkers to evaluate the presence of liver steatosis.8 When steatosis is identified, they suggest using non-invasive serum biomarkers to look for liver fibrosis. Patients at low risk for advanced fibrosis are followed-up every 2 years by repeating liver enzymes and fibrosis scores, whereas those at intermediate or high risk need to be referred to specialists to exclude other chronic liver diseases, to better assess disease severity and possibly to initiate specific therapy.
Non-invasive biomarkers of liver steatosis and fibrosis
We estimated the prevalence of liver steatosis using the Fatty Liver Index (FLI),14 the Hepatic Steatosis Index (HSI)15 and the NAFLD Ridge Score (NRS).16 Risk of advanced fibrosis was estimated using the Fibrosis-4 (FIB-4) score,17 the NAFLD Fibrosis Score (NFS),18 the AST/ALT ratio, and the AST to platelet ratio index (APRI).19 All scores were calculated as originally described (online supplementary table 1).14–19 The proposed cut-offs were used to identify patients at low, intermediate or high probability of advanced steatosis or fibrosis. To evaluate their impact in reducing indeterminate results, age-adjusted cut-offs for FIB-4 were also calculated, as recently proposed.20 In particular a cut-off of 2.0 was used to rule out advanced fibrosis in patients aged >65 years.
Supplemental material
Definition of CKD and CVD complications
Established cardiovascular disease was defined as a composite of coronary artery disease (acute coronary syndromes, revascularization procedures or stable angina), cerebrovascular disease (previous stroke, transient ischemic attack, or >35% carotid artery stenosis) and peripheral arterial disease requiring revascularization. The presence of an altered albumin excretion rate (AER) was defined as a urine albumin to creatinine ratio >30 mg/g. Diabetic retinopathy was diagnosed by dilated eye exam performed by an ophthalmologist. Estimated glomerular filtration rate (eGFR) was calculated from the Epidemiology Collaboration (EPI)-CKD equation and CKD was defined as an eGFR value less than 60 mL/min/1.73 m2. For the subgroup of patients in primary cardiovascular prevention, the risk of coronary heart disease (CHD), fatal CHD, stroke and fatal stroke was estimated using the 10-year United Kingdom Prospective Diabetes Study (UKPDS) Risk Engine V.2.0 algorithm, downloaded from Oxford University website: (https://www.dtu.ox.ac.uk/riskengine/download.php).
Analytical assessments
An interview on disease status, family history of metabolic disorders, personal history of previous diseases and pharmacologic therapy was collected on a routine-basis. Diabetes was diagnosed according to the American Diabetes Association criteria. Height (cm), body weight (kg), waist circumference (cm), smoking status, systolic and diastolic blood pressure (mm Hg) and heart rate at resting conditions were obtained at every follow-up visit by an experienced nurse. Body mass index (BMI) was calculated as weight/height (kg/m2). Metabolic syndrome was defined in accordance with the Adult Treatment Panel III (ATP III) criteria.21 Plasma levels of glucose, HbA1c, creatinine, AST, ALT, Gamma-glutamyltransferase (GGT), total cholesterol, high-density lipoprotein cholesterol, triglyceride, platelets, white blood cells and albumin were measured by local laboratories. In our daily practice we routinely ask for AST, ALT, GGT and a complete blood count in all of our patients as screening procedures as recommended by the Italian Standards of Care, but we do not routinely perform the assessment of total protein and electrophoresis, which are necessary for calculation of NFS. Low-density lipoprotein cholesterol was calculated according to Friedwald formula.
Statistical analysis
Analyses were performed using the SPSS software V.20.0. Data are expressed as means±SD for continuous variables or as numbers and percentages for categorical variables. All continuous variables were assessed for approximation to the normal distribution by the d’Agostino D-normality test.22 Logistic regression was performed to ascertain the effects of steatosis and fibrosis scores on macro and microvascular complications and low probability group of steatosis/fibrosis was selected as the reference category. Kruskal-Wallis test with Dunn-Bonferroni post hoc method was used to assess any differences in cardiovascular risks among patients in primary cardiovascular prevention. A p value of 0.05 was considered to be significant.
Results
Anthropometric and metabolic features of the population
A total of 2770 type 2 diabetes patients were included in the study. Data for calculating liver steatosis markers were available in 1519, 2076, and 1082 for FLI, HSI and NRS, respectively. Data for calculating liver fibrosis scores were available for 2096, 1429, 1421 and 370 for AST/ALT, APRI, FIB-4 and NFS, respectively. To test whether we were selecting a priori patients with severe liver disease we compared the clinical and metabolic features of the entire population with those of patients with available scores. These comparisons are summarized in online supplementary table 2, showing that these subpopulations did not differ with regards to clinical and metabolic features and prevalence of comorbidities. The features of these subpopulations did not differ from those of the entire cohort of type 2 diabetes patients.
Prevalence of liver steatosis and fibrosis
Figure 1 shows the prevalence of low, intermediate and high probability of liver steatosis and fibrosis according to each non-invasive marker. High probability of liver steatosis was present in the large majority of patients based on FLI, HSI and NRS (65%–88%). In contrast high probability of advanced fibrosis varied greatly according to different biomarkers (from 1% using APRI, to 33% using NFS). A large proportion of patients fell in the indeterminate zone risk (from 23.1% using APRI to 55.8% using AST/ALT).
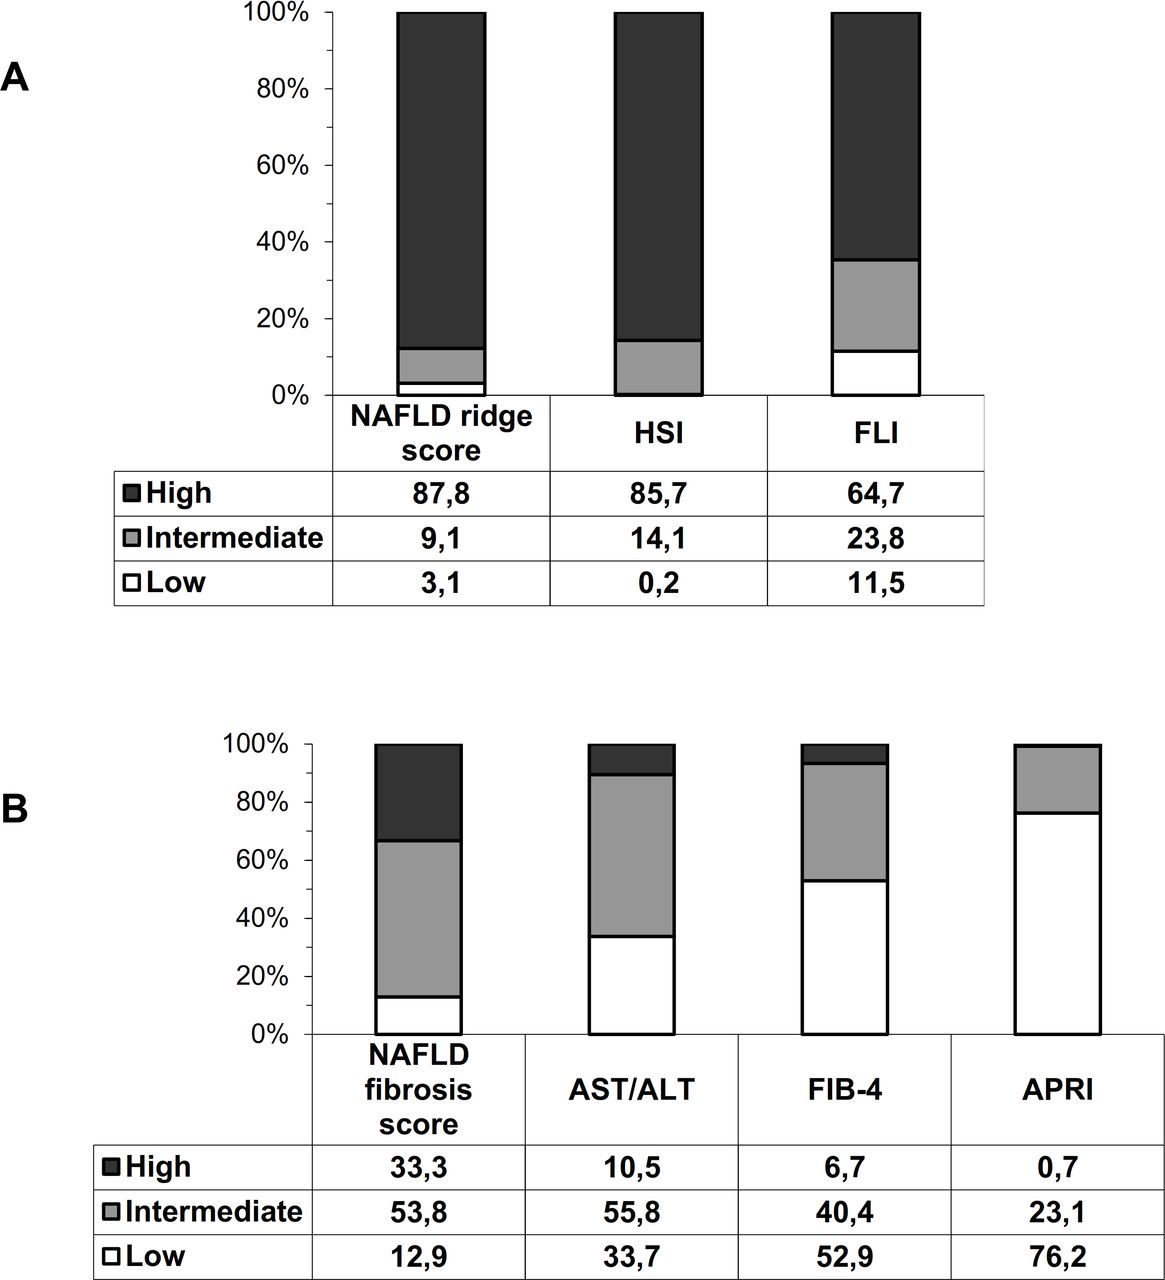
Percentage of patients at low, intermediate and high risk of fibrosis/steatosis according to the different biomarkers of steatosis (A) and fibrosis (B). white bars represent low probability of steatosis/fibrosis, gray bars represent intermediate probability and black bars represent high probability. APRI, AST to Platelet Ratio Index; FIB-4, fibrosis-4; FLI, Fatty Liver Index; HSI, Hepatic Steatosis Index; NAFLD, non-alcoholic fatty liver disease.
Application of diagnostic flow-chart
To estimate the proportion of patients that should be referred to second line evaluations according to the flow-chart of EASL-EASD-EASO guidelines, we analyzed the subgroup in which we could calculate both the FLI and the FIB-4. This population consisted of 1023 individuals, whose features were not different from those of the entire type 2 diabetes cohort (data not shown). As a first step, we used FLI to identify patients with steatosis (FLI >60) and found that it was present in 661 patients (65%). In the second step, patients with steatosis were stratified in those at low, intermediate and high risk of advanced fibrosis according to FIB-4 using both standard and recently proposed age-adjusted cut-offs23 (figure 2). When applying standard FIB-4 cut-offs 289 patients (43.7% of those with steatosis, 28.3% of the total population) would need to be referred to specialists because of either intermediate (n=253) or high (n=36) risk. This number decreased to 137 patients (20.7% of those with steatosis, 13.4% of the entire population) when age-adjusted cut-offs were applied (102 patients with intermediate and 35 patients with high risk). If we consider only patients at high risk of advanced fibrosis, then the percentage of referrals would decrease to 35 patients (5.3% of those with steatosis, 3.5% of the total cohort). We found similar results using HSI as a steatosis marker (data not shown).
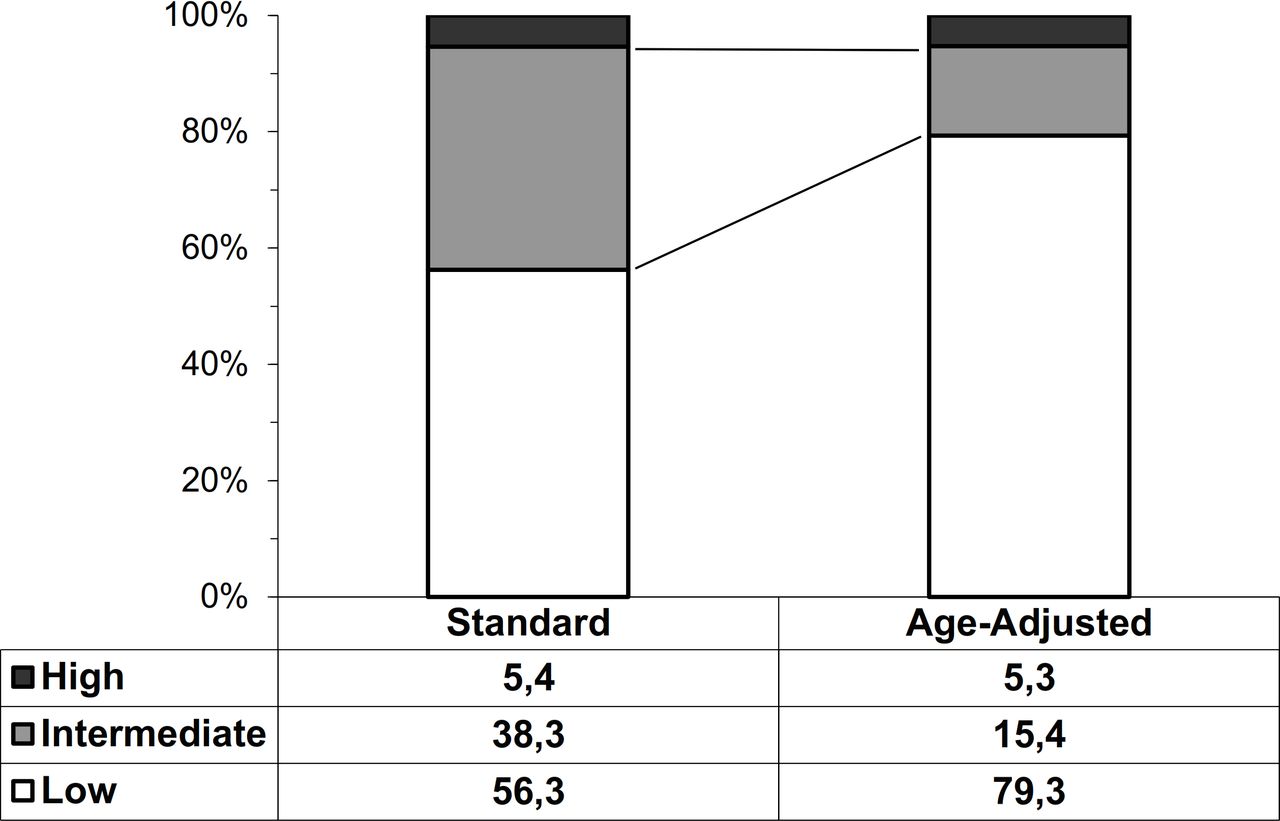
Proportion of patients with low, intermediate and high FIB-4 scores using standard and age-adjusted cut-offs. White bars represent low probability of fibrosis, gray bars represent intermediate probability and black bars represent high probability. Data are referred to patients with FLI>60. FIB-4, fibrosis-4; FLI, Fatty Liver Index.
Non-invasive biomarkers and diabetic complications
We found a higher prevalence of microalbuminuria in patients with an intermediate or high (OR: 3.49; 95% CI 2.05 to 5.94) category of FLI (table 1).
Logistic regression model comparing the prevalence of macrovascular, microvascular and kidney complications in individuals at high, intermediate or low (reference category) probability of liver fibrosis or steatosis
No significant differences could be detected with the other biomarkers of liver steatosis and fibrosis. A higher prevalence of diabetic retinopathy was found in patients with intermediate (OR: 1.58; 95% CI 1.1 to 2.3) and high (OR: 2.68; 95% CI 1.6 to 4.5) category of the AST/ALT ratio, whereas there was no association with the other biomarkers of liver steatosis or fibrosis.
A higher prevalence of CVD was observed in individuals in the intermediate (OR: 2.0; 95% CI 1.6 to 2.5) and high (OR: 2.6; 95% CI 1.7 to 4.0) risk categories for FIB-4 score and in intermediate (OR: 1.73; 95% CI 1.4 to 2.1) and high (OR: 1.86; 95% CI 1.4 to 2.5) categories of the AST/ALT ratio (table 1). Only a non-significant trend was found with an intermediate and high category of NFS and FLI.
A higher prevalence of eGFR <60 mL/min was found in individuals within the intermediate and high categories of all biomarkers of fibrosis except for APRI.
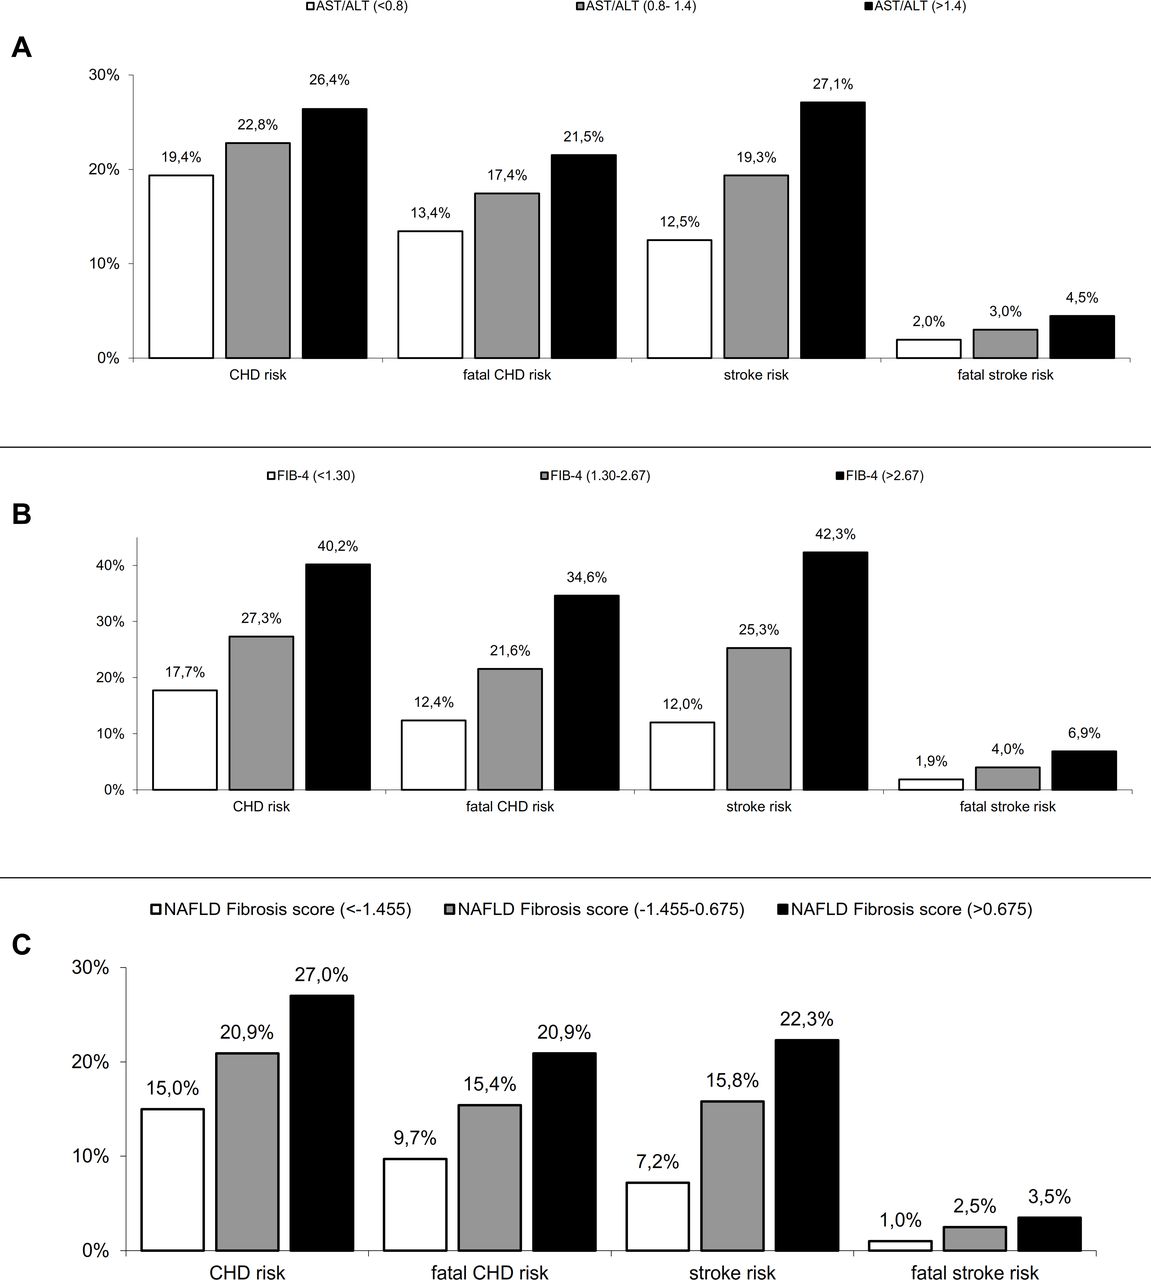
Figure 3 shows the cardiovascular risk of patients in primary cardiovascular prevention, assessed using the UKPDS risk engine, with low, intermediate and high levels of FIB-4, AST/ALT and NFS. Those within the lower risk of fibrosis showed a reduced risk of coronary heart disease (p<0.05), fatal CHD (p<0.03), stroke (p<0.02) and fatal stroke (p<0.01). We found no significant trend using the APRI score and scores of liver steatosis.
UKPDS risk of coronary heart disease (CHD), fatal CHD, stroke and fatal stroke according to different surrogate of fibrosis AST to ALT ratio (A), FIB-4 (B) and NAFLD fibrosis score (C). White bars represent low probability of fibrosis, gray bars represent intermediate probability and black bars represent high probability. FIB-4, Fibrosis-4; NAFLD, non-alcoholic fatty liver disease.
We then compared the clinical and metabolic features of cases selected for referral using the FLI-FIB-4 (age-adjusted) approach with those of entire cohort of patients with type 2 diabetes mellitus. Cases selected for referral did not differ with regards to age (69±11 vs 68±12, p=0.24), but had a higher BMI (33.0±4.9 vs 30.2±5.9, p<0.001), were more frequently males (67.2% vs 59.1%, p=0.045) and had a higher prevalence of microalbuminuria (39.0% vs 29.3%, p=0.021), CKD (38.5% vs 27.1%, p=0.002), CVD (54.0% vs 40.4%, p=0.001) and retinopathy (26.1% vs 17.8%, p=0.033). As shown in table 2 after correcting for sex and BMI, patients selected for referral still had a higher prevalence of CVD (OR: 1.86; 95% CI 1.30 to 2.64, p=0.001) and CKD (OR: 1.78; 95% CI 1.24 to 2.56, p=0.002) and a positive trend for microalbuminuria (OR: 1.49; 95% CI 0.99 to 2.26, p=0.057) and retinopathy (OR 1.60; 95% CI 0.97 to 2.66, p=0.065).
Logistic regression model comparing the prevalence of complications of diabetes in individuals selected for referral compared with the total cohort (reference category)
Discussion
In the present study we showed that applying the EASL-EASD-EASO guidelines to patients with type 2 diabetes using the sequential combination of two non-invasive markers of steatosis and fibrosis (FLI and FIB-4) would result in hepatologic referral of 28.3% of patients when applying standard cut-offs and that this number significantly dropped to 13.4% when recently published age-adjusted thresholds were used. Furthermore, we found a consistent association between biomarkers of liver steatosis and fibrosis and some chronic diabetic complications.
Given the increasing prevalence of NAFLD, routine referral of all patients to specialized hepatologists would not be sustainable and all clinicians are challenged to identify the small group of patients having an advanced form of the disease. Since liver biopsy is not applicable to large populations, readily available non-invasive fibrosis tests represent a very attractive option. In this context, our study is the largest to date to evaluate the number of patients with type 2 diabetes that should be referred to hepatologists based on the previously mentioned guidelines. In order to inform everyday clinical practice, we chose to include all patients referred to our clinic, making our study group representative of the population that attends diabetes clinics on a regular basis in a real-world setting. As, such we believe that our results could be extended to this population. In support of this, our results align in terms of frequency of disease with previous studies from a large Italian database (the Associazione Medici Diabetologi annals) with data coming from several diabetology clinics. In these studies the authors found a similar prevalence of NAFLD using FLI (~60%),24 and, in a smaller sample of ~1500 individuals with available clinical information, they reported a slightly higher prevalence of advanced fibrosis using FIB-4 (12%).25
While we found a great variability in the percentage of patients classified as having low–intermediate or high risk of advanced fibrosis based on the specific biomarkers used, we chose to apply the diagnostic flow-chart using FIB-4. FIB-4 and NFS are the two most validated scores in the literature as also mentioned in the guidelines.8 Data from the STELLAR trials, the largest studies to date on non-invasive tests of liver fibrosis found that FIB-4 had a higher Area Under the Receiver Operating Characteristics Curve (AUROC) compared with NFS and similar diagnostic accuracy when compared with more specialized tests such as Enhanced Liver Fibrosis (ELF) or Vibration Controlled Transient Elastography, especially in patients older than 65, which comprised ~60% of our population.26 Moreover, even though the guidelines do not specify which test to use in specific populations, NFS in patients with type 2 diabetes seems to identify most of the patients in the intermediate or high risk group probably because the variable hyperglycemia is included in the formula leading to spectrum bias27 and potentially to over-referral. In addition, it also requires the assessment of serum albumin concentration, which is not a routine test to be performed in the diabetes clinic.
One of the major limitations of non-invasive scores is that many patients fall in a gray zone where the diagnosis remains undetermined.28 Here, we tested for the first time how much the recently proposed age-adjusted cut-offs could reduce the number of indeterminate results and referrals in a real-life setting. If it is confirmed that the change in these cut-offs does not reduce sensitivity, while increasing specificity it is our opinion that it could confer a large advantage to better classify patients and avoid unnecessary referrals.20 In our population this resulted in 13.4% of patients with type 2 diabetes to refer, which seems to be a reasonable proportion of patients.
Another option to reduce indeterminate results is to use sequentially different biomarkers of liver fibrosis. Srivastava et al recently applied a two-step strategy in a primary care setting in which patients with a FIB-4 in the indeterminate range were evaluated using the ELF test.23 This approach led to a reduction in indeterminate results and in unnecessary referrals to hepatology clinics and rescued several patients with significant fibrosis that would have been falsely reassured by the FIB-4 score. Although the setting was different, a similar approach could potentially be more effective than a single step algorithm in diabetes clinics as well, although it remains to be proven.
Nonetheless an approach which bases referrals only on fibrosis stage is likely to miss a subset of patients with NASH and early fibrosis, who still need referral to a specialist since they are at high risk of developing advanced fibrosis or cirrhosis in the upcoming years.29 This underlines the need for reliable non-invasive biomarkers of NASH, which are still not available in clinical practice.
Our study was also the first to evaluate whether markers of liver steatosis and fibrosis are associated with specific microvascular and macrovascular complications of type 2 diabetes. Our results show that steatosis (and FLI in particular) is associated with the prevalence of altered albumin excretion rate, even after adjusting for BMI. This is in accordance with previous studies showing that insulin resistance, which correlates with indices of liver steatosis, probably plays an important part in the development of diabetic nephropathy30 and mice selectively lacking the insulin receptor in the kidney podocytes develop albuminuria even in the absence of hyperglycemia.31 In contrast with epidemiologic data reporting a higher incidence rate of CVD in patients with ultrasound-diagnosed NAFLD,32 we only found a trend between makers of livers steatosis and cardiovascular disease. On the other hand, our results align with a prospective study in which, after adjustment for several covariates, biomarkers of liver steatosis were not independently associated with incident CVD.33
In contrast, biomarkers of liver fibrosis correlated well with the prevalence of CVD and CKD, in particular FIB-4, NFS and AST/ALT, confirming similar findings reported in the general NAFLD population.34 Consistent with these data, we found a higher UKPDS cardiovascular risk in the subpopulation of diabetic patients in primary cardiovascular prevention.
This study has several strengths including the large sample size, a study group that represents the general type 2 diabetes population that attends secondary care diabetes clinics, the inclusion of both sexes and the good quality of data collection. In addition, we chose to evaluate hard cardiovascular clinical outcomes rather than markers of subclinical organ damage that were already described in previous studies.35
We also acknowledge certain limitations that require consideration. First, this was a cross-sectional analysis based on retrospective chart review and as such the present findings reflect an association with prevalent and not incident outcomes. Therefore, it does not provide evidence of a cause–effect relationship between liver steatosis and fibrosis and diabetic complications and prospective studies are needed to confirm our findings. Second, we used non-invasive score to asses liver fibrosis but could not evaluate the actual prevalence with gold standard techniques such as liver biopsy. Nevertheless, the aim of this study was not to evaluate the ability of these scores to predict advanced fibrosis, but to assess the feasibility of NAFLD screening in patients with type 2 diabetes and explore correlations between biomarkers and complications. Third, the diagnosis of CKD was based on the estimated eGFR calculated with the CKD-EPI formula, and misclassification of patients may have occurred. However, more precise evaluations are time-consuming and not readily applicable to clinical practice. Fourth, we did not systematically assess the presence of other etiologies of liver disease and the exclusion was based on what was reported by the patients or on available medical records. On the other hand the EASL-EASD-EASO Guidelines do not recommend the screening of these factors in their proposed algorithm8 but state that it should be performed following referral.
In conclusion, while the use of different non-invasive fibrosis scores among patients with type 2 diabetes identify different proportion of patients with advanced fibrosis, the use of age-adjusted FIB-4 cut-offs leads to a drop in gray-zone results, making referrals to hepatologists more sustainable for the healthcare system. Further combination with other techniques is likely to further reduce indeterminate results, but it still needs validation in the diabetologic setting. Interestingly non-invasive biomarkers were consistently associated with a different pattern of diabetic complications.
Acknowledgments
We thank the staff of the department of of Medicine and Rehabilitation, Policlinico di Monza for their helpful assistance.
References
Footnotes
Contributors All authors made substantial contributions to the conception and design or acquisition, analysis and interpretation of data. All authors drafted the article or revised it critically for important intellectual content. All authors approved the final version of the manuscript to be published. GP is the guarantor of this work.
Funding The authors have not declared a specific grant for this research from any funding agency in the public, commercial or not-for-profit sectors.
Competing interests None declared.
Patient consent for publication Not required.
Ethics approval The study protocol conformed to the ethical guidelines of the Current Declaration of Helsinki and was approved by the local Ethical Committee.
Provenance and peer review Not commissioned; externally peer reviewed.
Data availability statement Data are available upon reasonable request.