Article Text

Abstract
Objective Glucagon receptor (GCGR) blockage improves glycemic control and increases circulating glucagon-like peptide-1 (GLP-1) level in diabetic animals and humans. The elevated GLP-1 has been reported to be involved in the hypoglycemic effect of GCGR blockage. However, the source of this elevation remains to be clarified.
Research design and methods REMD 2.59, a human GCGR monoclonal antibody (mAb), was administrated for 12 weeks in db/db mice and high-fat diet+streptozotocin (HFD/STZ)-induced type 2 diabetic (T2D) mice. Blood glucose, glucose tolerance and plasma GLP-1 were evaluated during the treatment. The gut length, epithelial area, and L-cell number and proliferation were detected after the mice were sacrificed. Cell proliferation and GLP-1 production were measured in mouse L-cell line GLUTag cells, and primary mouse and human enterocytes. Moreover, GLP-1 receptor (GLP-1R) antagonist or protein kinase A (PKA) inhibitor was used in GLUTag cells to determine the involved signaling pathways.
Results Treatment with the GCGR mAb lowered blood glucose level, improved glucose tolerance and elevated plasma GLP-1 level in both db/db and HFD/STZ-induced T2D mice. Besides, the treatment promoted L-cell proliferation and LK-cell expansion, and increased the gut length, epithelial area and L-cell number in these two T2D mice. Similarly, our in vitro study showed that the GCGR mAb promoted L-cell proliferation and increased GLP-1 production in GLUTag cells, and primary mouse and human enterocytes. Furthermore, either GLP-1R antagonist or PKA inhibitor diminished the effects of GCGR mAb on L-cell proliferation and GLP-1 production.
Conclusions The elevated circulating GLP-1 level by GCGR mAb is mainly due to intestinal L-cell proliferation and GLP-1 production, which may be mediated via GLP-1R/PKA signaling pathways. Therefore, GCGR mAb represents a promising strategy to improve glycemic control and restore the impaired GLP-1 production in T2D.
- type 2 diabetes
- glucagon-like peptide-1 (GLP-1)
- glucagon receptor
- intestinal hormones
This is an open access article distributed in accordance with the Creative Commons Attribution Non Commercial (CC BY-NC 4.0) license, which permits others to distribute, remix, adapt, build upon this work non-commercially, and license their derivative works on different terms, provided the original work is properly cited, appropriate credit is given, any changes made indicated, and the use is non-commercial. See: http://creativecommons.org/licenses/by-nc/4.0/.
Statistics from Altmetric.com
Significance of this study
What is already known about this subject?
Glucagon receptor (GCGR) blockage improves glycemic control and elevates blood glucagon-like peptide-1 (GLP-1) level in diabetic animals and humans.
What are the new findings?
REMD 2.59, a fully competitive antagonistic human GCGR monoclonal antibody (mAb), increased the number of intestinal GLP-1-positive L-cells, and promoted L-cell proliferation and LK-cell expansion in type 2 diabetic (T2D) mice.
The GCGR mAb had a direct promoting effect on cell proliferation in cultured L-cell line GLUTag, and increased GLP-1 production in GLUTag cells, and primary mouse and human enterocytes.
GLP-1 receptor/protein kinase A signaling pathway was involved in the GCGR mAb-induced L-cell proliferation and GLP-1 production.
How might these results change the focus of research or clinical practice?
Gut-derived GLP-1 seems to play an important role in the GCGR mAb-induced glycemic improvement.
GCGR mAb represents a promising strategy to improve glycemic control and restore GLP-1 production in T2D.
Introduction
Type 2 diabetes (T2D) has been recognized as a bihormonal disorder, with insulin and glucagon exerting opposite effects on glucose metabolism. Current clinical therapies for T2D mainly focus on insulin, while targeting glucagon has been long dismissed.1 Glucagon acts through the glucagon receptor (GCGR), which is a G protein-coupled receptor expressed in the liver as well as multiple extrahepatic tissues, including the gastrointestinal tract.2 Accumulating evidence proves that disruption of GCGR signaling, using gene knockout, antisense oligonucleotide, antagonists or antibodies, can alleviate hyperglycemia in animals and humans.3–5 Recent data from our group and others have shown that REMD 2.59, a fully competitive antagonistic human GCGR monoclonal antibody (mAb), has a strong hypoglycemic effect in type 1 diabetic (T1D) and T2D rodents and non-human primates.6–10 Importantly, a phase I/II randomized clinical trial showed that REMD 477, another human GCGR mAb that differs by only one amino acid (which is not involved in glucagon binding) and has an affinity for the GCGR equivalent to that of REMD 2.59, improved glycemic control in patients with T1D, and no serious adverse effects were detected.11 Interestingly, our previous study discovered that REMD 2.59 induced pancreatic β-cell regeneration, which derived at least partially from transdifferentiation of pancreatic α-cells or δ-cells.6 7 These results indicate that GCGR mAb represents a novel therapeutic approach for diabetes therapy.
Glucagon-like peptide-1 (GLP-1), primarily synthesized by and secreted from intestinal L-cells, forms the basis for dozens of novel drugs against T2D.12 GLP-1 exerts multiple important physiological effects, including stimulated glucose-dependent insulin secretion and inhibited glucagon release.12–14 In individuals with T2D, decreased levels of plasma GLP-1 and reduced numbers of GLP-1-producing L-cells are in association with obesity and insulin resistance.15 Enhancing endogenous GLP-1 production or secretion has been considered as a novel option for diabetes therapy. Notably, GCGR blockage in animals resulted in elevation of the circulating GLP-1 level.16 17 However, how GLP-1 is elevated remains blurred.
In this study, we aimed to investigate whether GCGR blockage by REMD 2.59 increased GLP-1 level in T2D, and clarify how GLP-1 level was elevated. We first determined whether the GCGR mAb could lower blood glucose and increase plasma GLP-1 levels in db/db mice and high-fat diet+streptozotocin (HFD/STZ)-induced T2D mice. Next, we analyzed the parameters of intestinal histology including the numbers of enteroendocrine L-cells and LK-cells, and detected L-cell proliferation in these two T2D mouse models. Furthermore, we investigated whether L-cell proliferation and GLP-1 production were affected by the GCGR mAb in cultured mouse L-cell line, and primary mouse and human enterocytes. Finally, we explored the signaling mechanism of L-cell proliferation and GLP-1 production induced by the GCGR mAb in the L-cell line.
Materials and methods
Animal models and intervention
All animal experimental procedures were conducted at Peking University Health Science Center. Eight-week-old male db/db mice were used as a typical T2D model. To generate a less severe T2D model, 8-week-old male C57BL/6N mice were fed with HFD (fat 45%, carbohydrate 35% and protein 20%) for 16 weeks, and then given 50 mg/kg STZ via intraperitoneal injection. Diabetic condition was confirmed if the fasting blood glucose level was ≥11.1 mmol/L. Mice were sorted into groups having similar distributions based on body weight and blood glucose levels.
Both db/db and HFD/STZ-induced T2D mice were treated for 12 weeks by weekly intraperitoneal administration of REMD 2.59 (5 mg/kg) or saline (as control). The db/m mice treated with saline served as normal controls. There were four to nine mice per group. Mice were treated with 1 mg/mL 5-bromo-2’-deoxyuridine (BrdU) via drinking water for 7 days before being sacrificed. Fasting blood glucose was monitored using a portable OneTouch Ultra glucometer (LifeScan, Milpitas, California, USA) every 3 weeks. If the glucose level was greater than 33.3 mmol/L (upper detection limit of the glucometer), the value of 33.3 mmol/L was recorded. For hormone detection, dipeptidyl peptidase-4 inhibitor (50 µmol/L), aprotinin (1 µg/mL) and heparin sodium (1000 IU/mL) were added to each blood sample.
Glucose and insulin tolerance tests
Basal blood glucose levels were first measured after fasting either 16 hours for oral glucose tolerance test (OGTT) or 6 hours for insulin tolerance test (ITT). For OGTT, mice were given an oral gavage of D-glucose (2 g/kg), and blood glucose levels were measured at 30, 60 and 120 min. For ITT, insulin (0.75 U/kg) was intraperitoneally injected and blood glucose levels were measured at 15, 30, 60 and 120 min.
Immunofluorescent staining and morphometric analysis
Samples of 2 cm ileum (proximal to the cecum) were collected and fixed with 10% neutral-buffered formalin and embedded in paraffin, and 5 µm thick sections were prepared. To determine the surface area of villi/crypt and numbers of immunostained cells, H&E staining and immunofluorescent staining were used, respectively. We analyzed three to five independent sections per animal (spaced at least 1 mm) with four to nine mice per group. A minimum of 100 villi and crypts were scored per mouse.
For immunofluorescence, the sections were incubated with primary antibodies at 4°C overnight and secondary antibodies for 1 hour at room temperature, and stained with 1 µg/mL of 4’, 6-diamidino-2-phenylindole (DAPI). Images were examined using Leica TCS SP8 confocal fluorescence microscope (Leica Microsystems, Wetzlar, Germany). The antibodies and dilutions are described in online supplementary table S1.
Supplemental material
GLUTag cell culture
A mouse L-cell line GLUTag,18 kindly gifted by Professor Daniel J Drucker (Mt. Sinai Hospital, University of Toronto, Toronto, ON, Canada), was cultured as previously described.18 19 Cells were incubated with 1000 nmol/L GCGR mAb for 24 hours. The culture supernatants adding dipeptidyl peptidase-4 inhibitor (50 µmol/L) and aprotinin (1 µg/mL) were collected for ELISA, and cells were lysed for messenger RNA (mRNA) or protein analysis.
Primary intestinal cell cultures
C57BL/6N mice aged 8–10 weeks were chosen, and primary ileal cells were isolated and cultured as described previously.20 21 Fresh surgical specimens of morphologically normal colonic tissues were collected with consent from patients undergoing bowel resections for cancer. The tissues were stored in L-15 medium at 4°C until processing (within 2 hours of surgery). The isolation and culture of mixed human colonic cells were performed using the similar protocol as for mouse intestinal cell cultures, without the filtration step. Cells were incubated with 1000 nmol/L GCGR mAb for 24 hours. Culture supernatants were collected for ELISA and cells were lysed for mRNA or protein analysis.
CCK-8 cell proliferation assay
GLUTag cells were seeded at a density of 2×10³ cells per well onto the 96-well plates. Following overnight incubation, cells were incubated with various concentrations of GCGR mAb (1–1000 nmol/L) for 6–48 hours. Cell proliferation was evaluated with a Cell Counting Kit-8 (CCK-8) according to the manufacturer’s instructions.
BrdU incorporation assay
GLUTag cells were seeded at the bottom of cell culture dishes (Cat: 801001, NEST Biotechnology, Wuxi, China), which are designed especially for the subsequent confocal fluorescence detection. Cells were incubated with 1000 nmol/L GCGR mAb or phosphate-buffered saline (PBS) for 24 hours, and then 30 µg/mL BrdU was added for another 12 hours. The cell slides were fixed with 4% paraformaldehyde for 15 min, and the immunocytological staining was performed using rabbit anti-BrdU antibody at 4°C overnight and secondary antibodies for 1 hour at room temperature followed by DAPI staining. The percentages of BrdU-positive cells were counted for every 500 cells, and the data were presented from three independent experiments.
Cell cycle determination
GLUTag cells were seeded at a density of 1.5×10⁵ per dish and incubated overnight. After serum starvation for 12 hours, cells were incubated with 1000 nmol/L GCGR mAb or PBS for 24 hours. Subsequently, cells were fixed with 70% ethanol overnight at –20°C, stained with 50 µg/mL propidium iodide in the presence of 20 µg/mL RNase for 30 min at 37°C in the dark, and subjected to analysis on a flow cytometer (Becton-Dickinson, San Jose, California, USA).
Hormone measurements
Blood samples, culture supernatants and cell lysates were evaluated with specific ELISA kits for detecting insulin, glucagon, GLP-1 and GLP-2 according to the manufacturer’s instructions.
Conventional and quantitative RT-PCR
Total RNA was extracted with Trizol reagent and reverse-transcribed into complementary DNA. For conventional reverse transcription (RT)-PCR, specific transcript sequences were amplified using Applied Biosystems Veriti Thermal Cycler (Thermo Fisher Scientific, Waltham, Massachusetts, USA). The quantitative RT-PCR (qRT-PCR) was performed in triplicate using the SYBR qPCR Mix with QuantStudio 5 Real-Time PCR System (Thermo Fisher Scientific). Glyceraldehyde-3-phosphate dehydrogenase (GAPDH) served as internal reference. Relative quantification for qRT-PCR was calculated using the 2−ΔΔCT method. The primer sequences are summarized in online supplementary table S2.
Western blot
Total proteins were obtained using radioimmunoprecipitation assay (RIPA) lysis buffer which contained protease inhibitor and phosphatase inhibitor. Protein concentration was detected by bicinchoninic acid (BCA) protein assay method. The denatured protein (approximately 30 µg) was separated by 10% sodium dodecyl sulfate (SDS)-polyacrylamide gel electrophoresis (PAGE) and transferred to a nitrocellulose membrane. The membranes were blocked with 5% bovine serum albumin, incubated with primary antibodies at 4°C overnight and secondary antibodies for 1 hour, and visualized with an Odyssey 290 infrared imaging system (LI-COR Biosciences, Lincoln, Nebraska, USA). The antibodies and dilutions are presented in online supplementary table S1.
Statistical analysis
Data are expressed as mean±SD or median (IQR). Statistical differences were assessed by one-way analysis of variance followed by post-hoc Tukey-Kramer test, Student’s t-test (two-tailed), or Mann-Whitney test when appropriate. Statistical analyses were carried out using SPSS V.20.0. P<0.05 was considered statistically significant.
Results
GCGR mAb ameliorates hyperglycemia and elevates plasma active GLP-1 level in T2D mice
After 12-week treatment, the body weights of GCGR mAb-treated and saline-treated control groups were comparable in db/db mice (online supplementary figure S1A) and HFD/STZ-induced T2D mice (online supplementary figure S2A). GCGR mAb significantly lowered the fasting blood glucose (figure 1A,G) and improved glucose tolerance (figure 1B,H) in the two T2D models. Insulin sensitivity as evaluated by an ITT had no difference between the GCGR mAb and control groups (online supplementary figures S1B and S2B). The fasting and postload insulin levels during OGTT were increased by GCGR mAb in db/db mice (figure 1C and online supplementary figure S1C) and HFD/STZ-induced T2D mice (figure 1I and online supplementary figure S2C). Plasma glucagon, active GLP-1 and GLP-2 levels were increased by GCGR mAb in the two T2D models (figure 1D–F,J–L).

Metabolic parameters of db/db mice and HFD/STZ-induced type 2 diabetic mice treated with GCGR mAb or vehicle for 12 weeks. A GCGR mAb, REMD 2.59 (5 mg/kg), or saline was intraperitoneally administrated once a week in male diabetic db/db mice (A–F) or HFD/STZ-induced T2D mice (G–L). Age-matched male db/m mice treated with saline were included as the normal controls of db/db mice. (A, G) Fasting blood glucose during the 12-week treatment. (B, H) Blood glucose levels during OGTT; fasting plasma levels of (C, I) insulin, (D, J) glucagon, (E, K) active GLP-1, and (F, L) GLP-2 after the 12-week treatment. The arrowheads in A and B indicate the upper detection limit of the glucometer (33.3 mmol/L). n=4–9 mice per group. Data are shown as mean±SD. Statistical analysis was conducted by one-way analysis of variance followed by post-hoc Tukey-Kramer test or Student’s t-test when appropriate; *p<0.05 versus saline; #p<0.05 versus db/m; §p<0.05 versus pretreatment in the same group. GCGR, glucagon receptor; GLP-1, glucagon-like peptide-1; GLP-2, glucagon-like peptide-2; HFD/STZ, high-fat diet+streptozotocin; mAb, monoclonal antibody; OGTT, oral glucose tolerance test; T2D, type 2 diabetes.
GCGR mAb increases the number of intestinal L-cells in T2D mice
To ascertain whether the rise of circulating GLP-1 levels was correlated with an increase in the number of intestinal GLP-1-producing L-cells, the intestinal histology was determined. Results showed that treatment with the GCGR mAb elongated the length of the intestine from the duodenum to the rectum and expanded the size of the epithelial area in db/db mice (figure 2A,B) and HFD/STZ-induced T2D mice (figure 3A,B). Immunofluorescence staining displayed that the treatment augmented the number of GLP-1-positive L-cells per epithelial area in the two T2D mouse models (figures 2C,E and 3C,E).
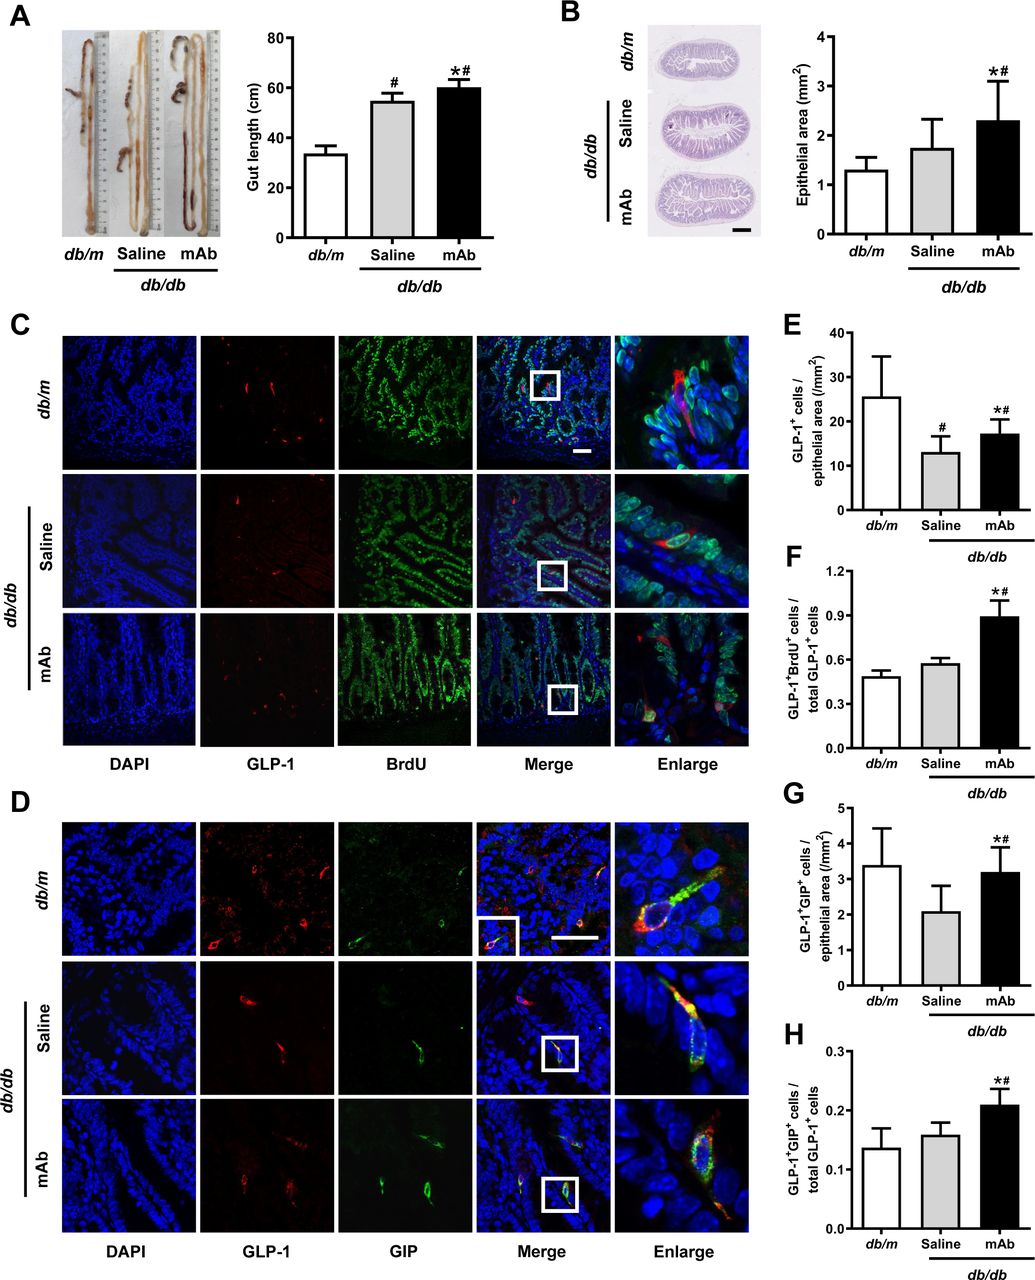
Histological analysis in the ilea of diabetic db/db mice treated with GCGR mAb or saline for 12 weeks. Age-matched db/m mice served as the normal controls. (A) Representative image showing the length of the intestine and quantification of the mean gut length. (B) H&E staining of the ileum section and quantification of the mean epithelial area. Scale bar=500 µm. n=4–5 mice per group. (C, D) Representative immunostaining photographs of the ilea. Cells in boxes are enlarged in the fifth column. Scale bar=50 µm. (E–H) Quantification of L-cells (E), proliferating L-cells (F) and LK-cells (G, H). n=3–5 sections per mouse multiplied by 4–5 mice per group. Data are shown as mean±SD. Statistical analysis was conducted using one-way analysis of variance followed by post-hoc Tukey-Kramer test; *p<0.05 versus saline; #p<0.05 versus db/m. BrdU, 5-bromo-2’-deoxyuridine; DAPI, diamidino-2-phenylindole; GCGR, glucagon receptor; GIP, glucose-dependent insulinotropic polypeptide; GLP-1, glucagon-like peptide-1; mAb, monoclonal antibody.
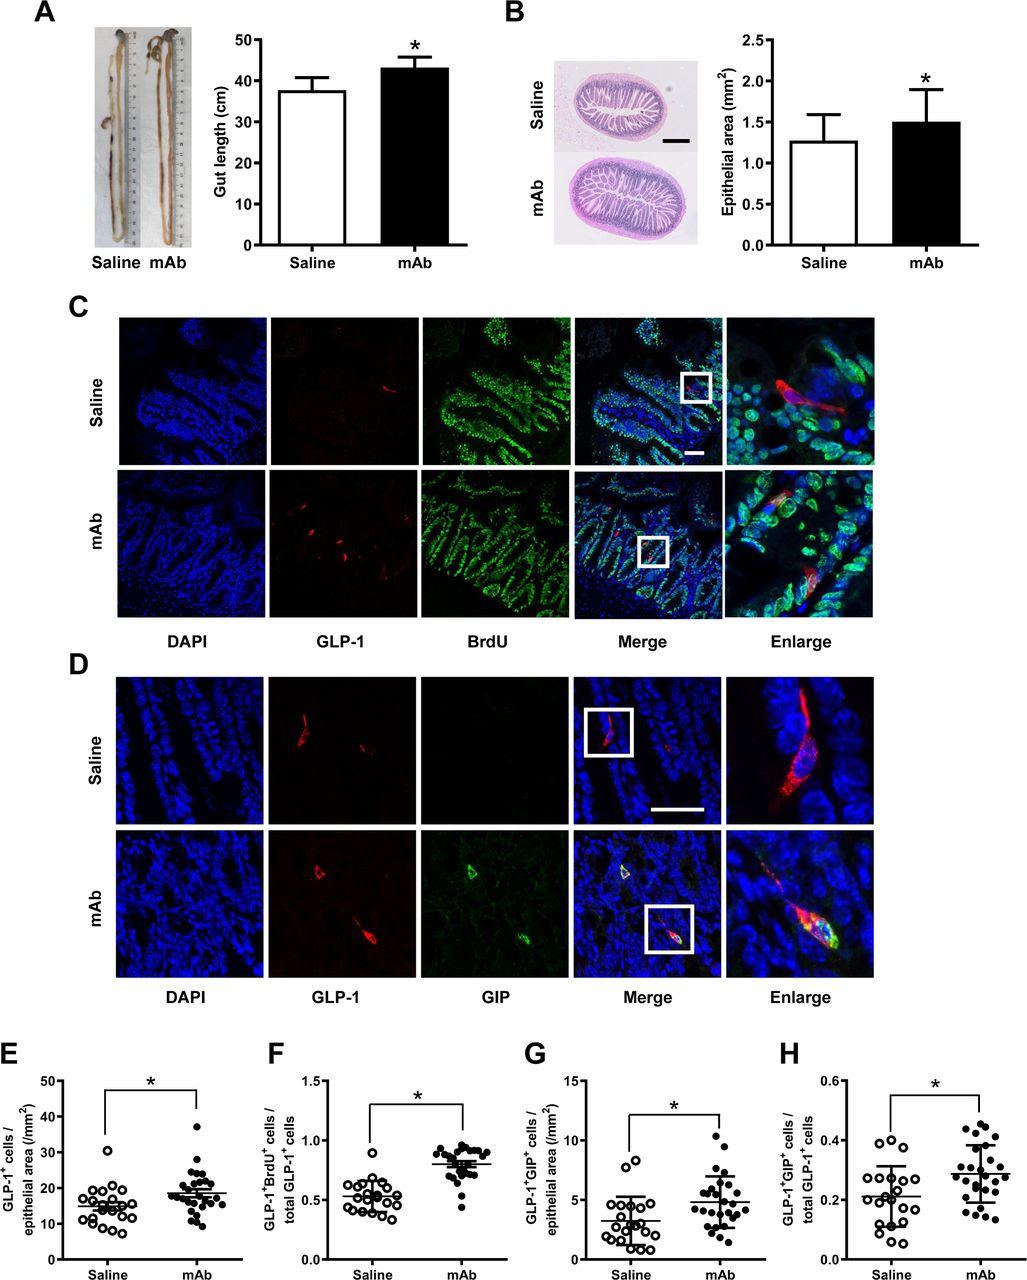
Histological analysis in the ilea of HFD/STZ-induced type 2 diabetic mice treated with GCGR mAb or saline for 12 weeks. (A) Representative image showing the length of the intestine and quantification of the mean gut length. (B) H&E staining of the ileum section and quantification of the mean epithelial area. Scale bar=500 µm. n=7–9 mice per group. (C, D) Representative immunostaining photographs of the ilea. Cells in boxes are enlarged in the fifth column. Scale bar=50 µm. (E–H) Quantification of L-cells (E), proliferating L-cells (F) and LK-cells (G, H). n=3–5 sections per mouse multiplied by 7–9 mice per group. Data are expressed as mean±SD or median (IQR). Statistical differences were assessed by Student’s t-test (two-tailed) or Mann-Whitney test when appropriate; *p<0.05 versus saline. BrdU, 5-bromo-2’-deoxyuridine; DAPI, diamidino-2-phenylindole; GCGR, glucagon receptor; GIP, glucose-dependent insulinotropic polypeptide; GLP-1, glucagon-like peptide-1; HFD/STZ, high-fat diet+streptozotocin; mAb, monoclonal antibody.
GCGR mAb promotes the proliferation of L-cells and increases the number of LK-cells in T2D mice
We subsequently determined the possible origin of the increased intestinal L-cells. Cell proliferation was detected using BrdU incorporation analysis. We found that the number of GLP-1 and BrdU double-positive cells and the ratio of these double-positive cells over the total number of GLP-1-positive cells were increased after GCGR mAb treatment in the two T2D mouse models (figures 2C,F and figure 3C,F).
Because some L-cells coexpressed GLP-1 and glucose-dependent insulinotropic polypeptide (GIP), we estimated whether the numbers of LK-cells (coexpress GLP-1 and GIP) were altered following the GCGR mAb treatment. The immunostaining showed that the ileum contained substantial number of LK-cells (figures 2D and 3D). The numbers of LK-cells per epithelial area and the percentage of LK-cells over the total number of GLP-1-positive cells were increased by GCGR mAb in db/db mice (figure 2G,H) and HFD/STZ-induced T2D mice (figure 3G,H). By contrast, GCGR mAb did not change the number of GIP-positive K-cells (online supplementary figures S1D and S2D).
Next, we analyzed the levels of transcription factors that were associated with the differentiation of L-cells and LK-cells. qRT-PCR analysis revealed that the mRNA levels of paired box 6 (Pax6) and pancreatic and duodenal homeobox-1 (Pdx1), but not neurogenin3 (Ngn3), were upregulated by GCGR mAb in both db/db mice (online supplementary figure S1E-G) and HFD/STZ-induced T2D mice (online supplementary figure S2E-G), indicating that GCGR mAb did not alter the differentiation in the initial stages of enteroendocrine cells, while it might have an effect on the differentiation in the later stages.
GCGR mAb promotes the proliferation of L-cells in vitro
To determine whether GCGR mAb had a direct effect on L-cells, we treated the mouse L-cell line GLUTag with GCGR mAb. We found that GLUTag cells could produce not only GLP-1 (figure 4F–H) but also glucagon (online supplementary figure S3D,E). Moreover, GCGR was expressed in the cells (online supplementary figure S4A,B), suggesting that the endogenous glucagon released from the cells had an effect on themselves, and GCGR mAb treatment might block the glucagon signaling without addition of exogenous glucagon. Therefore, the GLUTag cell line was an ideal model for our study. We incubated GLUTag cells with different concentrations of GCGR mAb for up to 48 hours. CCK-8 assay showed that GCGR mAb dose-dependently and time-dependently promoted cell growth within 24 hours (figure 4A and online supplementary figure S3A). BrdU incorporation assay demonstrated that the percentage of BrdU-positive cells was increased by GCGR mAb (figure 4B and online supplementary figure S3B). Cell cycle analysis showed that the proportion of cells in the S phase (the period of DNA synthesis) was increased and the proportion of G0/G1 compartments was reduced by GCGR mAb (figure 4C and online supplementary figure S3C). qRT-PCR and western blot analyses indicated that the mRNA and protein levels of PCNA (proliferating cell nuclear antigen) and Ki67, two widely used markers for cell proliferation, were upregulated by GCGR mAb (figure 4D,E).

Detection of cell proliferation and GLP-1 production in mouse L-cell line GLUTag cells, and primary mouse and human enterocytes cultured with GCGR mAb or vehicle. (A) GLUTag cells were incubated with GCGR mAb (1, 10, 100 and 1000 nmol/L) for different time periods (6, 12, 24 and 48 hours). Cell proliferation was measured using the Cell Counting Kit-8 assay and the area under the curve during 24 hours was calculated. (B) Quantification of BrdU-positive cells per total cells after a 24-hour GCGR mAb (1000 nmol/L) or vehicle treatment following 12-hour BrdU incorporation. (C) Cell cycle distributions determined by flow cytometry after treatment with GCGR mAb (1000 nmol/L) or vehicle for 24 hours. (D, E) Relative mRNA and protein levels of the cell proliferation markers PCNA (D) and Ki67 (E) were detected by qRT-PCR and western blot after cells were cultured with 1000 nmol/L GCGR mAb for 24 hours. (F–N) Proglucagon (GCG) expression and GLP-1 production in GLUTag cells (F–H), primary mouse enterocytes (I–K), and primary human enterocytes (L–N) cultured with GCGR mAb (1000 nmol/L) or vehicle for 24 hours. Relative mRNA levels of GCG were detected by qRT-PCR (F, I, L), and intracellular (G, J, M) and supernatant (H, K, N) GLP-1 protein levels were measured by ELISA. Data were obtained from at least three independent experiments and are presented as mean±SD. Statistical analysis was conducted by one-way analysis of variance followed by post-hoc Tukey-Kramer test or Student’s t-test when appropriate. Data in A: *p<0.05 (1000 nmol/L versus control); #p<0.05 (100 nmol/L versus control); &p<0.05 (10 nmol/L versus control). Data in B–N: *p<0.05 versus control. BrdU, 5-bromo-2’-deoxyuridine; GAPDH, glyceraldehyde-3-phosphate dehydrogenase; GCG, proglucagon; GCGR, glucagon receptor; GLP-1, glucagon-like peptide-1; mAb, monoclonal antibody; mRNA, messenger RNA; PCNA, proliferating cell nuclear antigen; qRT-PCR, quantitative reverse transcription PCR.
GCGR mAb upregulates proglucagon (Gcg) expression and GLP-1 production in GLUTag cells, and primary mouse and human enterocytes
Similar to GLUTag cells, isolated mouse and human primary enterocytes produced glucagon (online supplementary figure S3F-I) and expressed GCGR (online supplementary figure S4A, B), indicating that GCGR mAb could block the action of their endogenous glucagon. To determine whether GCGR mAb increased GLP-1 production in vitro, we measured the levels of intracellular and supernatant GLP-1, and expression of its coding gene Gcg in the three systems. We found that GCGR mAb upregulated Gcg mRNA expression and promoted GLP-1 synthesis and secretion in GLUTag cells (figure 4F–H), mouse primary enterocytes (figure 4I–K) and human primary enterocytes (figure 4L–N). In addition, intracellular and supernatant levels of glucagon were upregulated by GCGR mAb in GLUTag cells (online supplementary figure S3D,E). By contrast, glucagon secretion was unchanged, and glucagon synthesis was increased by GCGR mAb in primary mouse and human enterocytes (online supplementary figure S3F-I).
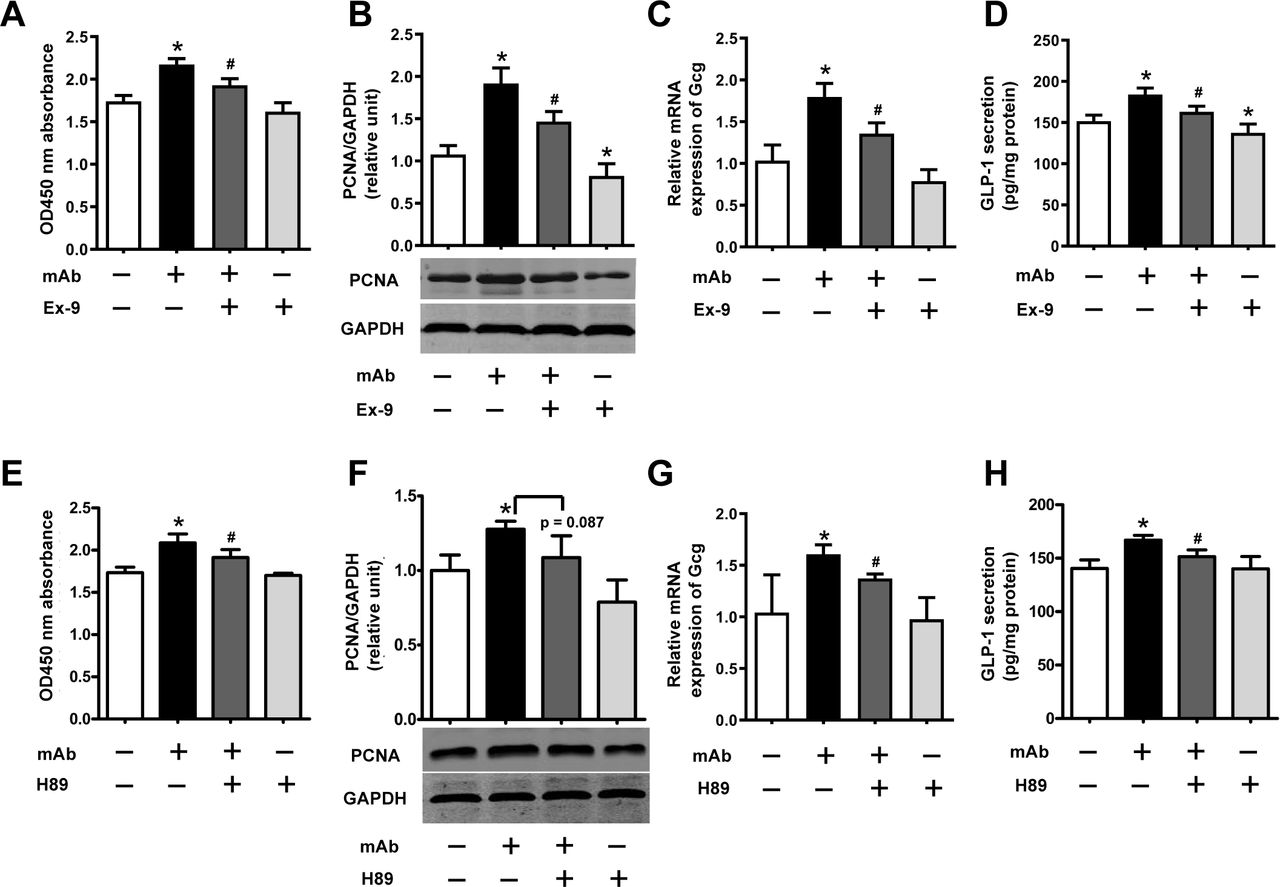
GCGR mAb promotes L-cell proliferation and GLP-1 production through activation of the GLP-1R/PKA signaling pathways
Finally, we explored the mechanism how GCGR mAb promoted L-cell proliferation and GLP-1 production. We hypothesized that autocrine and/or paracrine GLP-1 might contribute to the effects of GCGR mAb through activating GLP-1 receptor (GLP-1R) and its downstream signaling. We demonstrated that GLP-1R was expressed in GLUTag cells by RT-PCR and western blot analyses (online supplementary figure S4C, D), and the phosphorylation of protein kinase A (PKA) (a downstream signaling of GLP-1R) was upregulated by GCGR mAb (online supplementary figure S5). Importantly, addition of exendin (9–39) (a GLP-1R antagonist) or H89 (a PKA inhibitor) partially reversed the GCGR mAb-induced upregulation of L-cell proliferation, Gcg expression and GLP-1 secretion (figure 5). These results indicated that GLP-1R/PKA signaling pathways were involved in L-cell proliferation and GLP-1 production induced by GCGR mAb.
Signaling pathways involved in the GCGR mAb-induced L-cell proliferation and GLP-1 production. GLUTag cells were preincubated with the GLP-1R antagonist exendin (9–39) (Ex-9; 200 nmol/L) or PKA inhibitor H89 (10 μmol/L) for 30 min and then coincubated with 1000 nmol/L GCGR mAb for an additional 23.5 hours. (A, E) Cell proliferation was measured using the Cell Counting Kit-8 assay. (B, F) The protein levels of PCNA were determined by western blot. (C, G) Relative mRNA expression of Gcg was detected by qRT-PCR. (D, H) Supernatant GLP-1 protein levels were assayed by ELISA. Data are presented as mean±SD. n=6 in A–D, and n=3 in E–H. Statistical analysis was conducted using one-way analysis of variance followed by post-hoc Tukey-Kramer test; *p<0.05 versus control; #p<0.05 versus GCGR mAb. GAPDH, glyceraldehyde-3-phosphate dehydrogenase; GCG, proglucagon; GCGR, glucagon receptor; GLP-1, glucagon-like peptide-1; GLP-1R, GLP-1 receptor; mAb, monoclonal antibody; mRNA, messenger RNA; PCNA, proliferating cell nuclear antigen; PKA, protein kinase A; qRT-PCR, quantitative reverse transcription PCR.
Discussion
In this study, we found that REMD 2.59, a fully competitive antagonistic human GCGR mAb, lowered blood glucose and elevated plasma GLP-1 level in db/db mice and HFD/STZ-induced T2D mice. GCGR mAb increased the number of intestinal GLP-1-positive L-cells, which was associated with L-cell proliferation and LK-cell expansion. Interestingly, GCGR mAb had a direct promoting effect on cell proliferation in cultured L-cell line GLUTag. GCGR mAb increased GLP-1 production in GLUTag cells, and primary mouse and human enterocytes. Furthermore, GLP-1R/PKA signaling pathway was involved in the GCGR mAb-induced L-cell proliferation and GLP-1 production.
Glucagon, mainly secreted from pancreatic α-cells, promotes glucose production via binding to and activating the GCGR. Gcgr knockout mice displayed an antidiabetogenic effect in both T1D and T2D mice.22–25 Despite numerous compounds having been developed during the last two decades, most agents were discontinued for further development due to some unexpected adverse events.3 5 Therefore, developing a safe and efficacious GCGR antagonist remains highly needed. Being a fully human GCGR mAb, REMD 2.59 has several desirable attributes as potential therapeutic agents, including a high affinity to GCGR, a relatively long circulating half-life, the highly specific antagonistic activity against GCGR and minimal adverse effects.6 9 Consistent with the previous reports of our and other groups,6 8 9 this study demonstrated that the GCGR mAb lowered fasting blood glucose, improved glucose tolerance and increased active GLP-1 levels in T2D mice.
GLP-1, a well-known incretin hormone, lowers glycemia by several mechanisms.26 Glp-1r knockout or GLP-1R antagonist diminished the hypoglycemic effects of GCGR mAb treatment, suggesting that elevated GLP-1 levels might be involved in the hypoglycemic effects of GCGR blockage.16 Our study revealed that plasma active GLP-1 level was elevated by GCGR mAb. Where the elevated GLP-1 came from was an interesting question. Under physiological conditions, intestinal L-cells (diffusely scattered through the gut epithelium, and most abundant in the distal small intestine and the colon) are the main origin of GLP-1.27 28 We found that GCGR mAb increased intestinal GLP-1-positive L-cell numbers per area, elongated the length of the intestine, and expanded the size of the epithelial area in T2D mice. These results suggested that the increased L-cells might account for the elevated GLP-1 level in the circulation, which is consistent with the data from Gcgr knockout mice.29 However, another study reported no elevated GLP-1 level in the intestine after GCGR mAb treatment.16 The reason for this discrepancy may be that different parts of intestine were investigated (the lower ileum in our study, while the proximal duodenum in Gu et al’s study16). A recent study showed that deletion of Gcg gene in the mouse distal gut reduced the plasma active GLP-1 levels, highlighting the essential role of the distal gut in the regulation of GLP-1 secretion.30 Considering the distribution of L-cells, the lower ileum was more suitable for evaluating L-cell mass and GLP-1 content than the proximal duodenum. Of course, further studies investigating L-cells in the entire intestinal tract are needed to provide detailed changes of the L-cell mass. Although gut-derived GLP-1 is essential for glucose homeostasis,30 it is worth noting that we could not exclude other sources of GLP-1. For example, our previous study showed that pancreatic α-cells could express PC1/3 and process Gcg into GLP-1 after GCGR mAb treatment,6 suggesting that the increased plasma GLP-1 level might also derive from pancreatic α-cells. The tissue-specific Gcg or Pcsk1 (the coding gene of PC1/3) knockout mice would be helpful.
Next, we explored the possible reason for the increased number of intestinal L-cells after GCGR mAb treatment. We discovered that GCGR mAb promoted intestinal L-cell proliferation as indicated by GLP-1 and BrdU double staining in both db/db and HFD/STZ-induced T2D mice. Besides, GCGR mAb had a direct stimulating effect on cell proliferation in GLUTag L-cells. Increased LK-cells might also be a reason for the augmentation of L-cell number, which is in agreement with the results obtained from Gcgr knockout mice.29 To further clarify the process and signals of differentiation of enteroendocrine progenitors into L-cells after GCGR mAb treatment, the expression of several transcription factors was analyzed. During the embryo development, Ngn3 determines which cells become enteroendocrine cells, and Pax6 activates Gcg gene expression in L-cells.31 32 Subsequently, the post-translational processing of Gcg yields to GLP-1, GLP-2, oxyntomodulin and glicentin.33 In K-cells, GIP expression is activated by concomitant expression of Pax6 and Pdx1.34 35 In our study, Ngn3 mRNA level was unchanged by GCGR mAb treatment, suggesting that GCGR blockage did not affect the initial stages of the enteroendocrine cell differentiation. By contrast, the mRNA levels of Pax6 and Pdx1 were upregulated, which suggested that these two transcription factors might be involved in L-cell differentiation and Gcg expression.
In our study, GLP-1 synthesis and secretion were increased by GCGR mAb in GLUTag cells, and primary mouse and human enterocytes. Subsequently, how GCGR mAb promoted L-cell proliferation and GLP-1 production was further investigated. We found that L-cells not only secreted GLP-1 but also expressed GLP-1R, suggesting that GLP-1-producing L-cells could have autocrine and/or paracrine regulation on themselves. By using the specific antagonist or inhibitor, we showed that GLP-1R/PKA signaling pathway was involved in the upregulation of L-cell proliferation and GLP-1 production induced by GCGR mAb. In addition, a recent study reported that an increase in GLP-1 secretory capacity could be achieved by preserving the native GLP-1-secreting cells and thereby obtaining an increased L-cell mass.36 Therefore, GCGR blockage is an important strategy for enhancing long-term endogenous GLP-1 secretion.
Unexpectedly, we observed that the intestine was longer in the GCGR mAb-treated group than that in the control group. The increase in the gut length might be mediated via GLP-2, since GLP-2 (which also derives from Gcg through PC1/3 processing in L-cells) is best known for its role in stimulating intestinal growth and promoting nutrient absorption.37 Intriguingly, emerging evidence suggests that GLP-2 participates in the regulation of glucose homeostasis38 and GLP-1/GLP-2 coagonists display marked effects on gut volume and glycemic control in mice.39 In our study, GCGR mAb elevated the plasma levels of both GLP-1 and GLP-2, and might thus serve as GLP-1/GLP-2 coagonist in a sense.
There are some limitations to this study and several questions need to be answered. First, glucagon is known to stimulate insulin secretion from β-cells, and blocking GCGR would cause a direct decrease in insulin secretion. However, in this study, GCGR mAb increased rather than decreased insulin level in T2D mice. We tried to answer this question from several aspects, including β-cell regeneration (eg, transdifferentiation of pancreatic α-cells or δ-cells)6 7 and elevated circulating GLP-1 level, due to gut-derived GLP-1 (in this study) and islet-derived GLP-1 (our ongoing study) production. How the promoting factors overwhelm the direct effect of glucagon remains to be clarified. Second, we measured GLP-1 content and secretion in cultured L-cells under basal condition rather than high glucose condition. It has been reported that GLUTag cells grown at either low or high concentration of glucose respond to stimuli in a similar way, and no differences in GLP-1 production and secretion were found in cells exposed to either low or high glucose.40 Besides, GLUTag cells grown with high glucose were more resistant to a further metabolic insult.41 Therefore, it does make sense that we cultured GLUTag cells in Dulbecco’s modified Eagle medium (DMEM) containing 5.5 mM glucose. Third, isolated primary enterocytes rather than purified primary L-cells were used to detect Gcg mRNA, GLP-1 content and secretion. As is known, L-cells are very scarce among enterocytes, and the detection of Gcg expression and GLP-1 production might be affected by other enterocytes. However, it is difficult to isolate adequate pure L-cells from primary intestine at present. Fortunately, the primary culture technique of mouse and human intestinal cells has been well established to study the secretion of a variety of gut peptides, including GLP-1 and GIP, in response to diverse stimuli and inhibitors.20 21 42 In addition, data obtained from primary intestinal cultures have often been translatable in the in vivo setting.43
In conclusion, our study expands knowledge of the pharmacological functions of GCGR mAb and shows that GCGR mAb increases GLP-1 level in the circulation by promoting L-cell proliferation and GLP-1 secretion, which are mediated via GLP-1R/PKA signaling pathway. Gut-derived GLP-1 seems to play an important role in the GCGR mAb-induced glycemic improvement. Therefore, GCGR mAb may represent a promising strategy to ameliorate hyperglycemia and restore the impaired GLP-1 production in T2D.
Acknowledgments
We thank Dr Hai Yan (REMD Biotherapeutics, Camarillo, California) for kindly providing REMD 2.59. We thank Professor Daniel J Drucker (Mt. Sinai Hospital, University of Toronto, Toronto, ON, Canada) for the kind gift of the GLUTag cells to Professor Xiaopei Cao (Sun Yat-sen University, Guangzhou, China). We also thank Liu Yang (Tsinghua University, Beijing, China), Xuning Wang (Chinese PLA General Hospital, Beijing, China) and Huangmeng Xiao (Sun Yat-sen University) for technical assistance.
References
Footnotes
Correction notice This article has been corrected since it was published. The GLUTag cells were used in the lab of Professor Xiaopei Cao (Department of Endocrinology, Sun Yat-sen University, Guangzhou, China), and the cell line was provided by Professor Daniel J Drucker (Mt. Sinai Hospital, University of Toronto, ON, Canada).
Contributors SL, RW and TH designed the research. SL, JY, KY, LG, XC and TW performed the experiments. SL, JL, YL, HW, RW and TH analyzed the data. SL and RW wrote the paper. TH reviewed and edited the manuscript. RW and TH are the guarantors of this work, and as such had full access to all the data in the study and take responsibility for the integrity of the data and the accuracy of the data analysis.
Funding This work was supported by the National Key Research and Development Program of China (2016YFA0100501), the National Natural Science Foundation of China (81830022, 81770768, 81970671, 91749101, 81800730 and 81670701), and the Natural Science Foundation of Beijing (7192225).
Disclaimer The funding sources had no role in study design, collection, analysis and interpretation of data, writing of the report, and decision to submit the article for publication.
Competing interests None declared.
Patient consent for publication Not required.
Ethics approval All animal experimental procedures were approved by the Animal Care and Use Committee of Peking University. The use of human intestinal tissues was approved by the Ethics Committee of Peking University Third Hospital.
Provenance and peer review Not commissioned; externally peer reviewed.
Data availability statement All data relevant to the study are included in the article or uploaded as supplementary information. The data sets generated during the current study are available from the corresponding authors upon reasonable request.